
The Log Hero reports
Once data is arriving, Log Hero appears as its own Log Hero section in the sidebar of your Keyword Hero account, with seven reports in it. They all read the same log data. What differs is the question each one is built to answer.
If you only open one, open Bot Activity. The rest are for when you have a specific question.
| Report | The question it answers |
|---|---|
| Bot Activity | Which bots crawl my site, and are they running into problems? |
| AI Visibility | Are ChatGPT, Claude and Perplexity actually reaching my important pages? |
| Crawl Budget & Waste | Where is a search bot spending crawl budget it shouldn’t? |
| Bots vs Humans | Which pages get crawled but never visited, and the other way round? |
| Coverage | Of everything my sitemap advertises, what has actually been fetched? |
| What Changed | Did anything move this week that I should look at? |
| URL Drilldown | What happened to this exact URL — did my fix work? |
Bot Activity
Section titled “Bot Activity”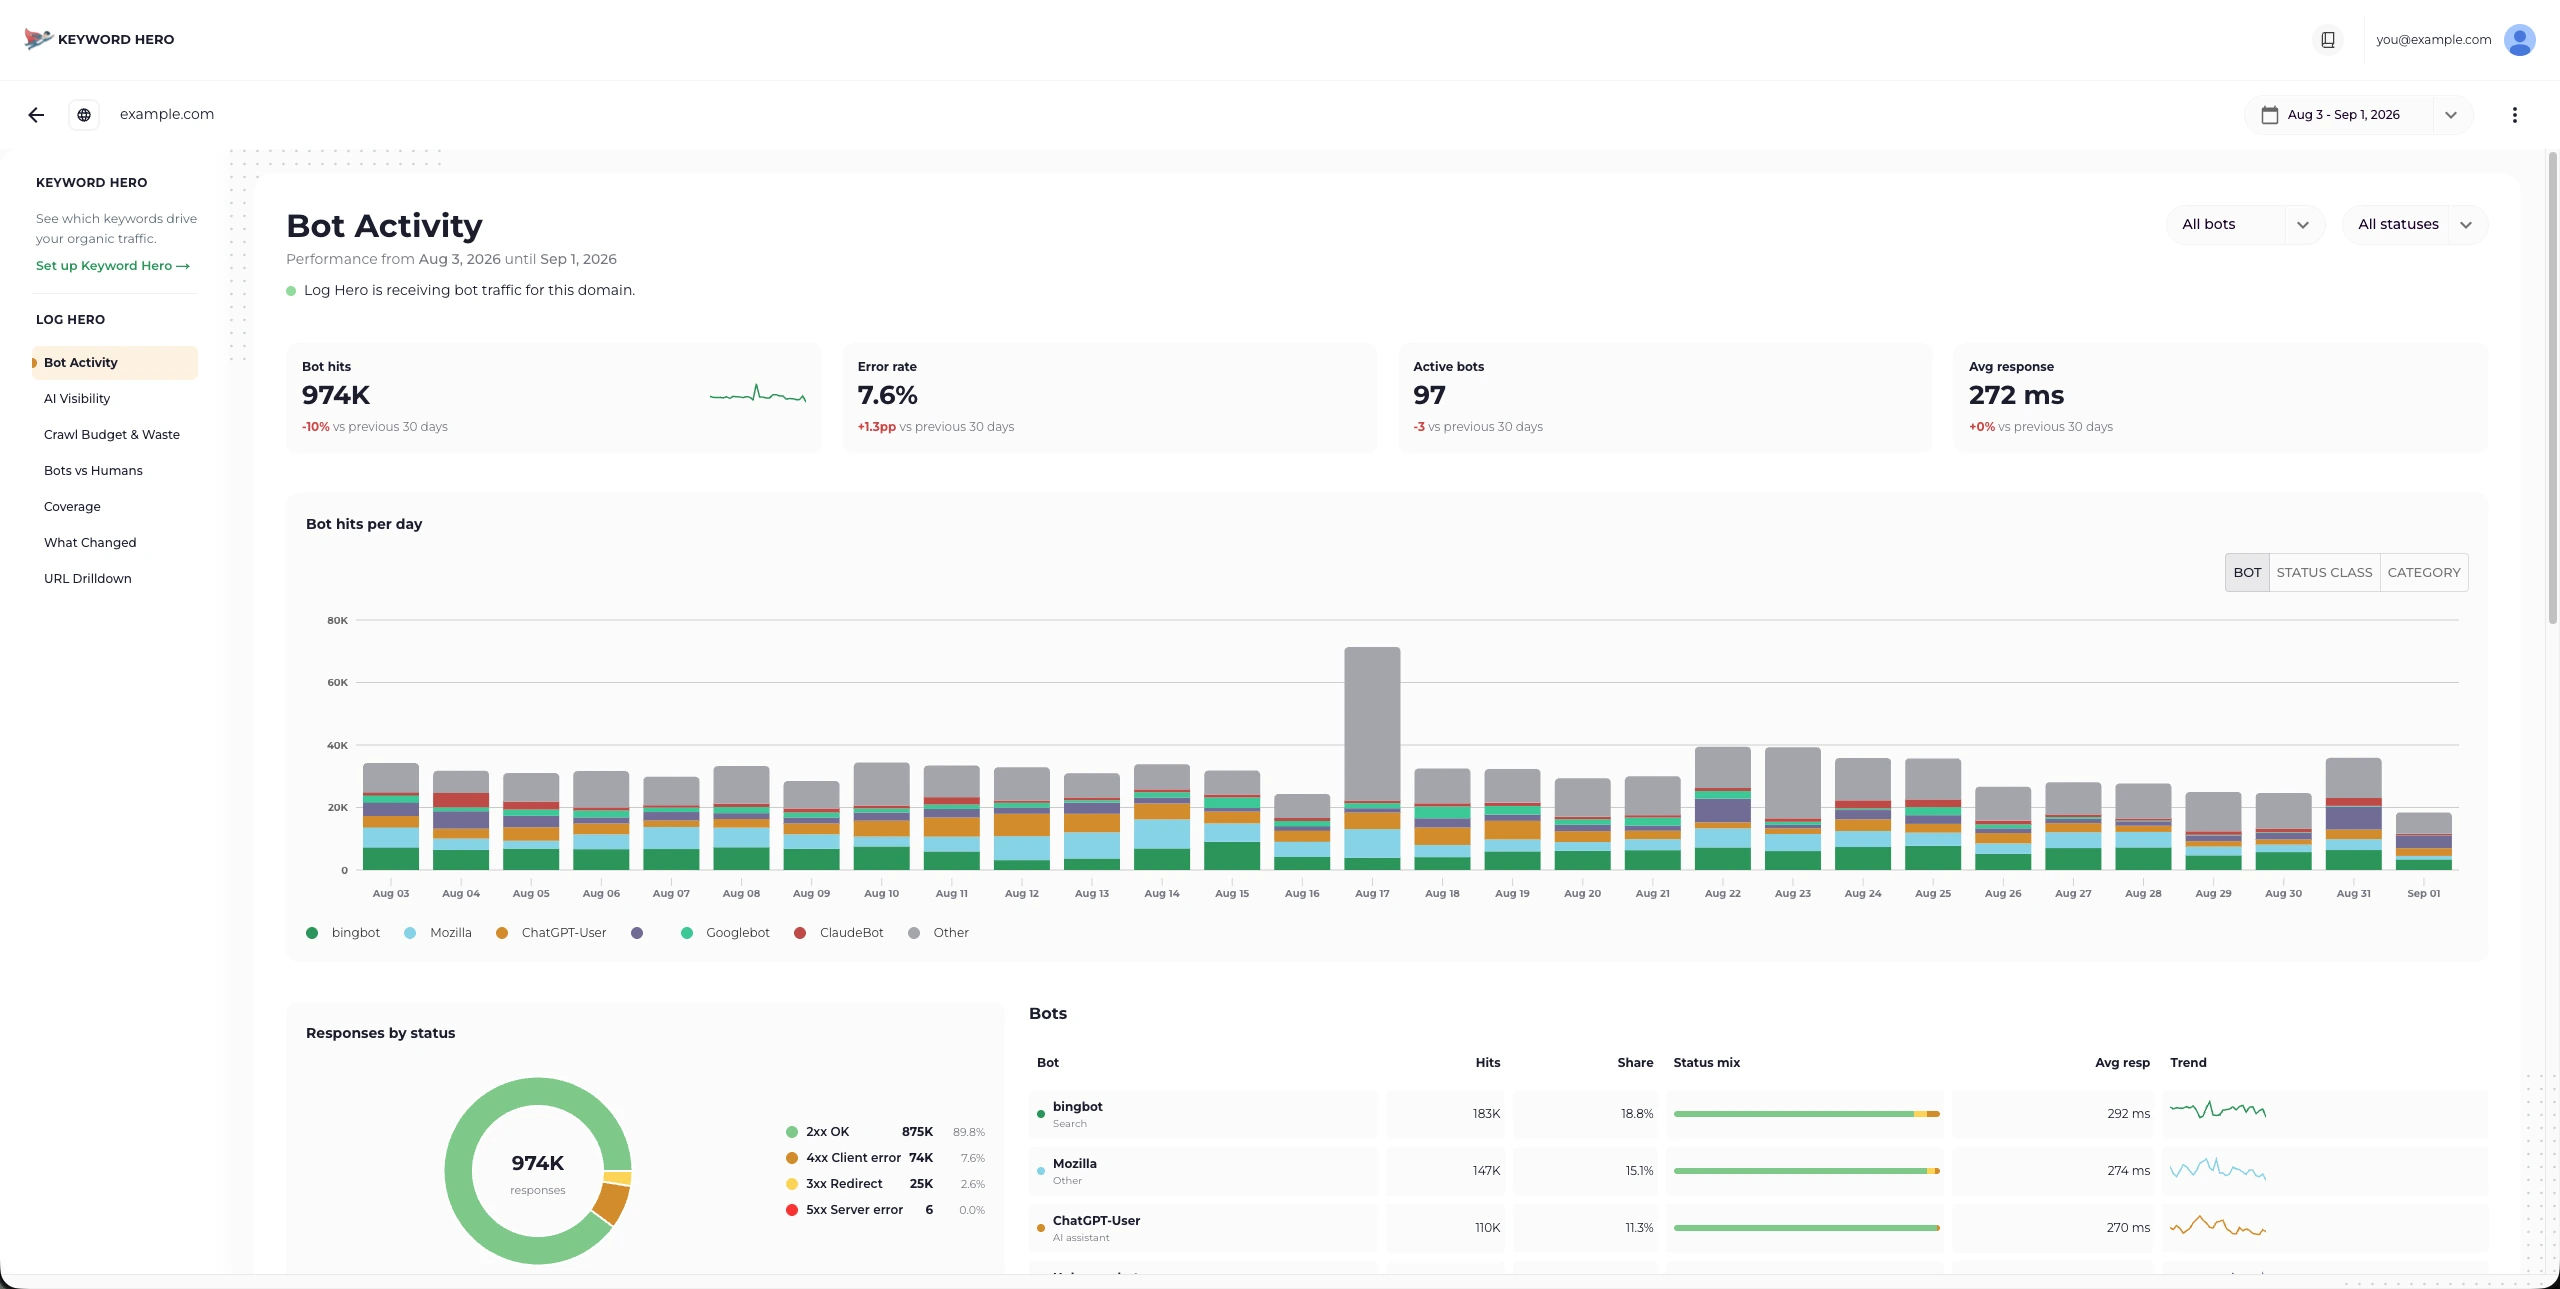
Bot Activity. The four tiles carry a delta against the previous period of the same length.
The overview. Four figures across the top — Bot hits, Error rate, Active bots, Avg response — each against the previous period of the same length, so you can see direction and not just level.
Below that: crawl volume per day, which you can view broken down by bot, by status class or by category; the mix of status codes; a table of every bot with its share, status mix and response time; the most crawled paths; the most common errors; and a verified-versus-unverified split.
Start here after setup, and come back to it when something feels off without being specific.
AI Visibility
Section titled “AI Visibility”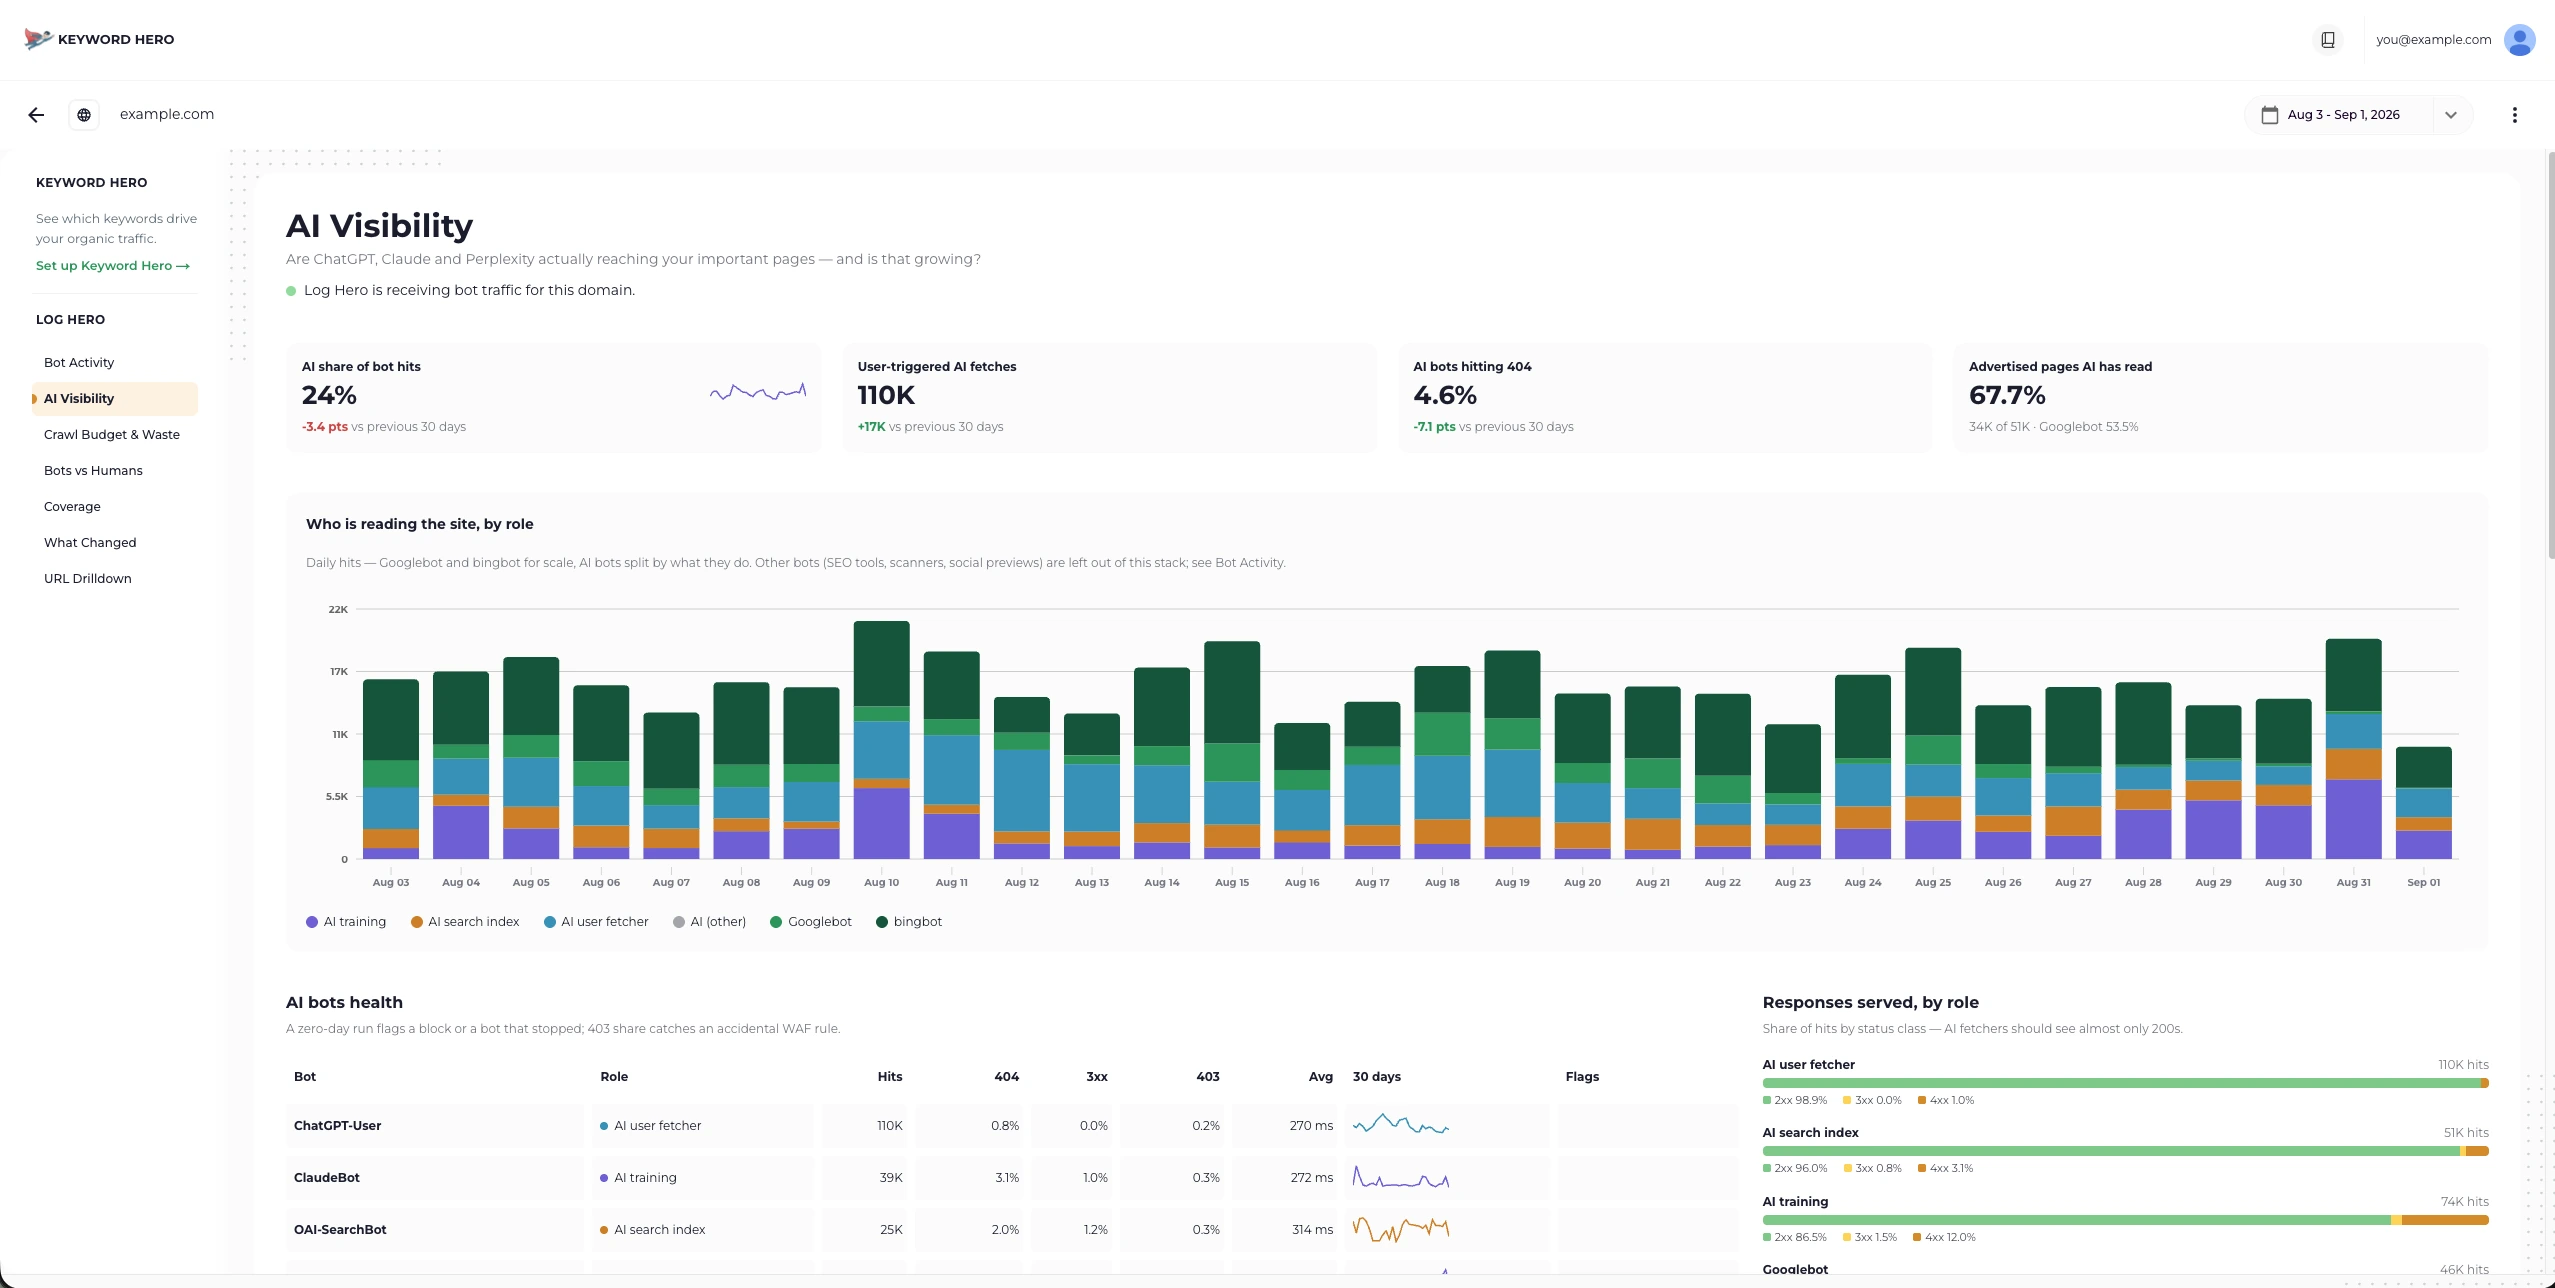
AI Visibility. The stacked chart splits AI bots by role and keeps Googlebot and bingbot in for scale.
Separates AI crawlers by what they are doing, which is the distinction that matters and the one a raw log cannot make for you — the long version is in Search, training and retrieval crawlers:
- AI training — collecting content to train a model.
- AI search index — building an index to answer questions from.
- AI user fetcher — opening your page right now because someone asked an assistant about it.
That last one is the interesting one. It means a person was in the loop. The report shows which pages get fetched that way, how the AI crawlers’ 404 and 403 rates compare to Googlebot’s, and which sections of your site AI reads more or less than Google does.
Two things it deliberately does not claim: whether an assistant cited you is not in your logs, and a page fetched by a crawler that does not run JavaScript may still have been read as empty.
Crawl Budget & Waste
Section titled “Crawl Budget & Waste”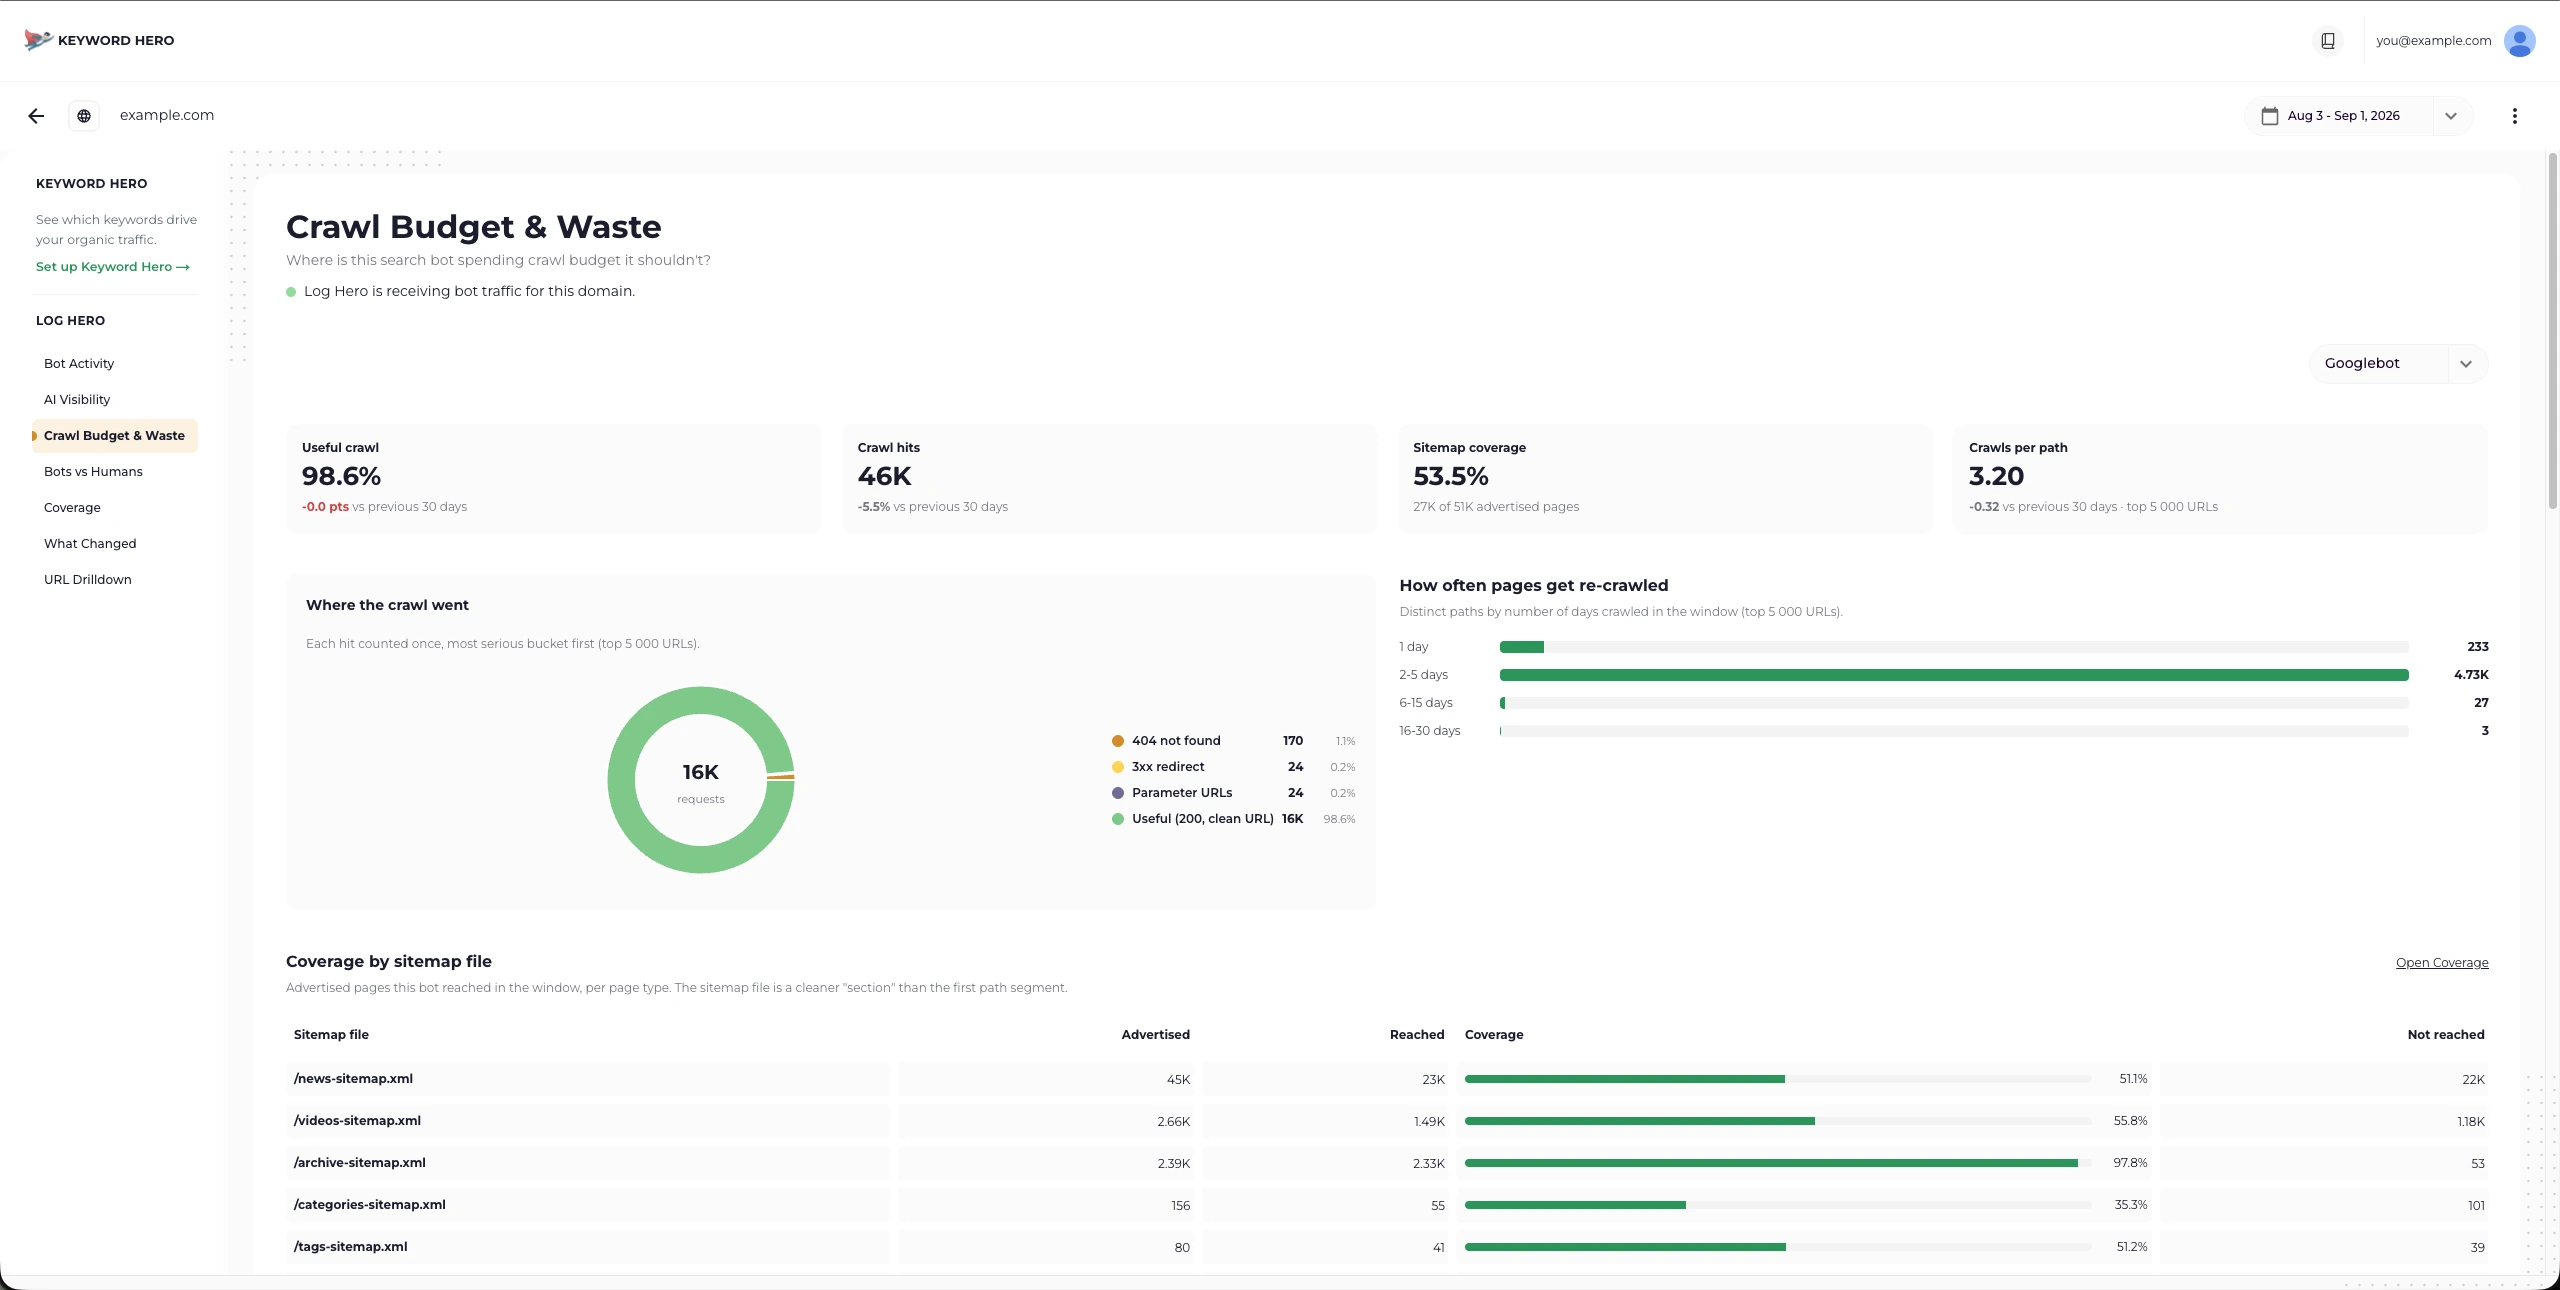
Crawl Budget & Waste, one bot at a time. Here 98.7% of Googlebot’s crawl is useful — the remaining 1.3% is where the work is.
Pick a bot — Googlebot by default — and see where its crawling goes. Useful crawl versus waste, how often pages get re-crawled, crawl split by section, and the three classic sinks: paths that keep 404ing, redirects that keep being followed, and parameter URLs multiplying into thousands of near-duplicates.
It also shows crawl split across hostnames, which is how you find out that a staging host or a non-www variant is quietly absorbing a share of your crawl.
Note the report’s own framing: a clean 404 is cheap for Google. The expensive thing is whatever still links to it. Redirect chains and parameter URLs cost more than plain 404s do.
Bots vs Humans
Section titled “Bots vs Humans”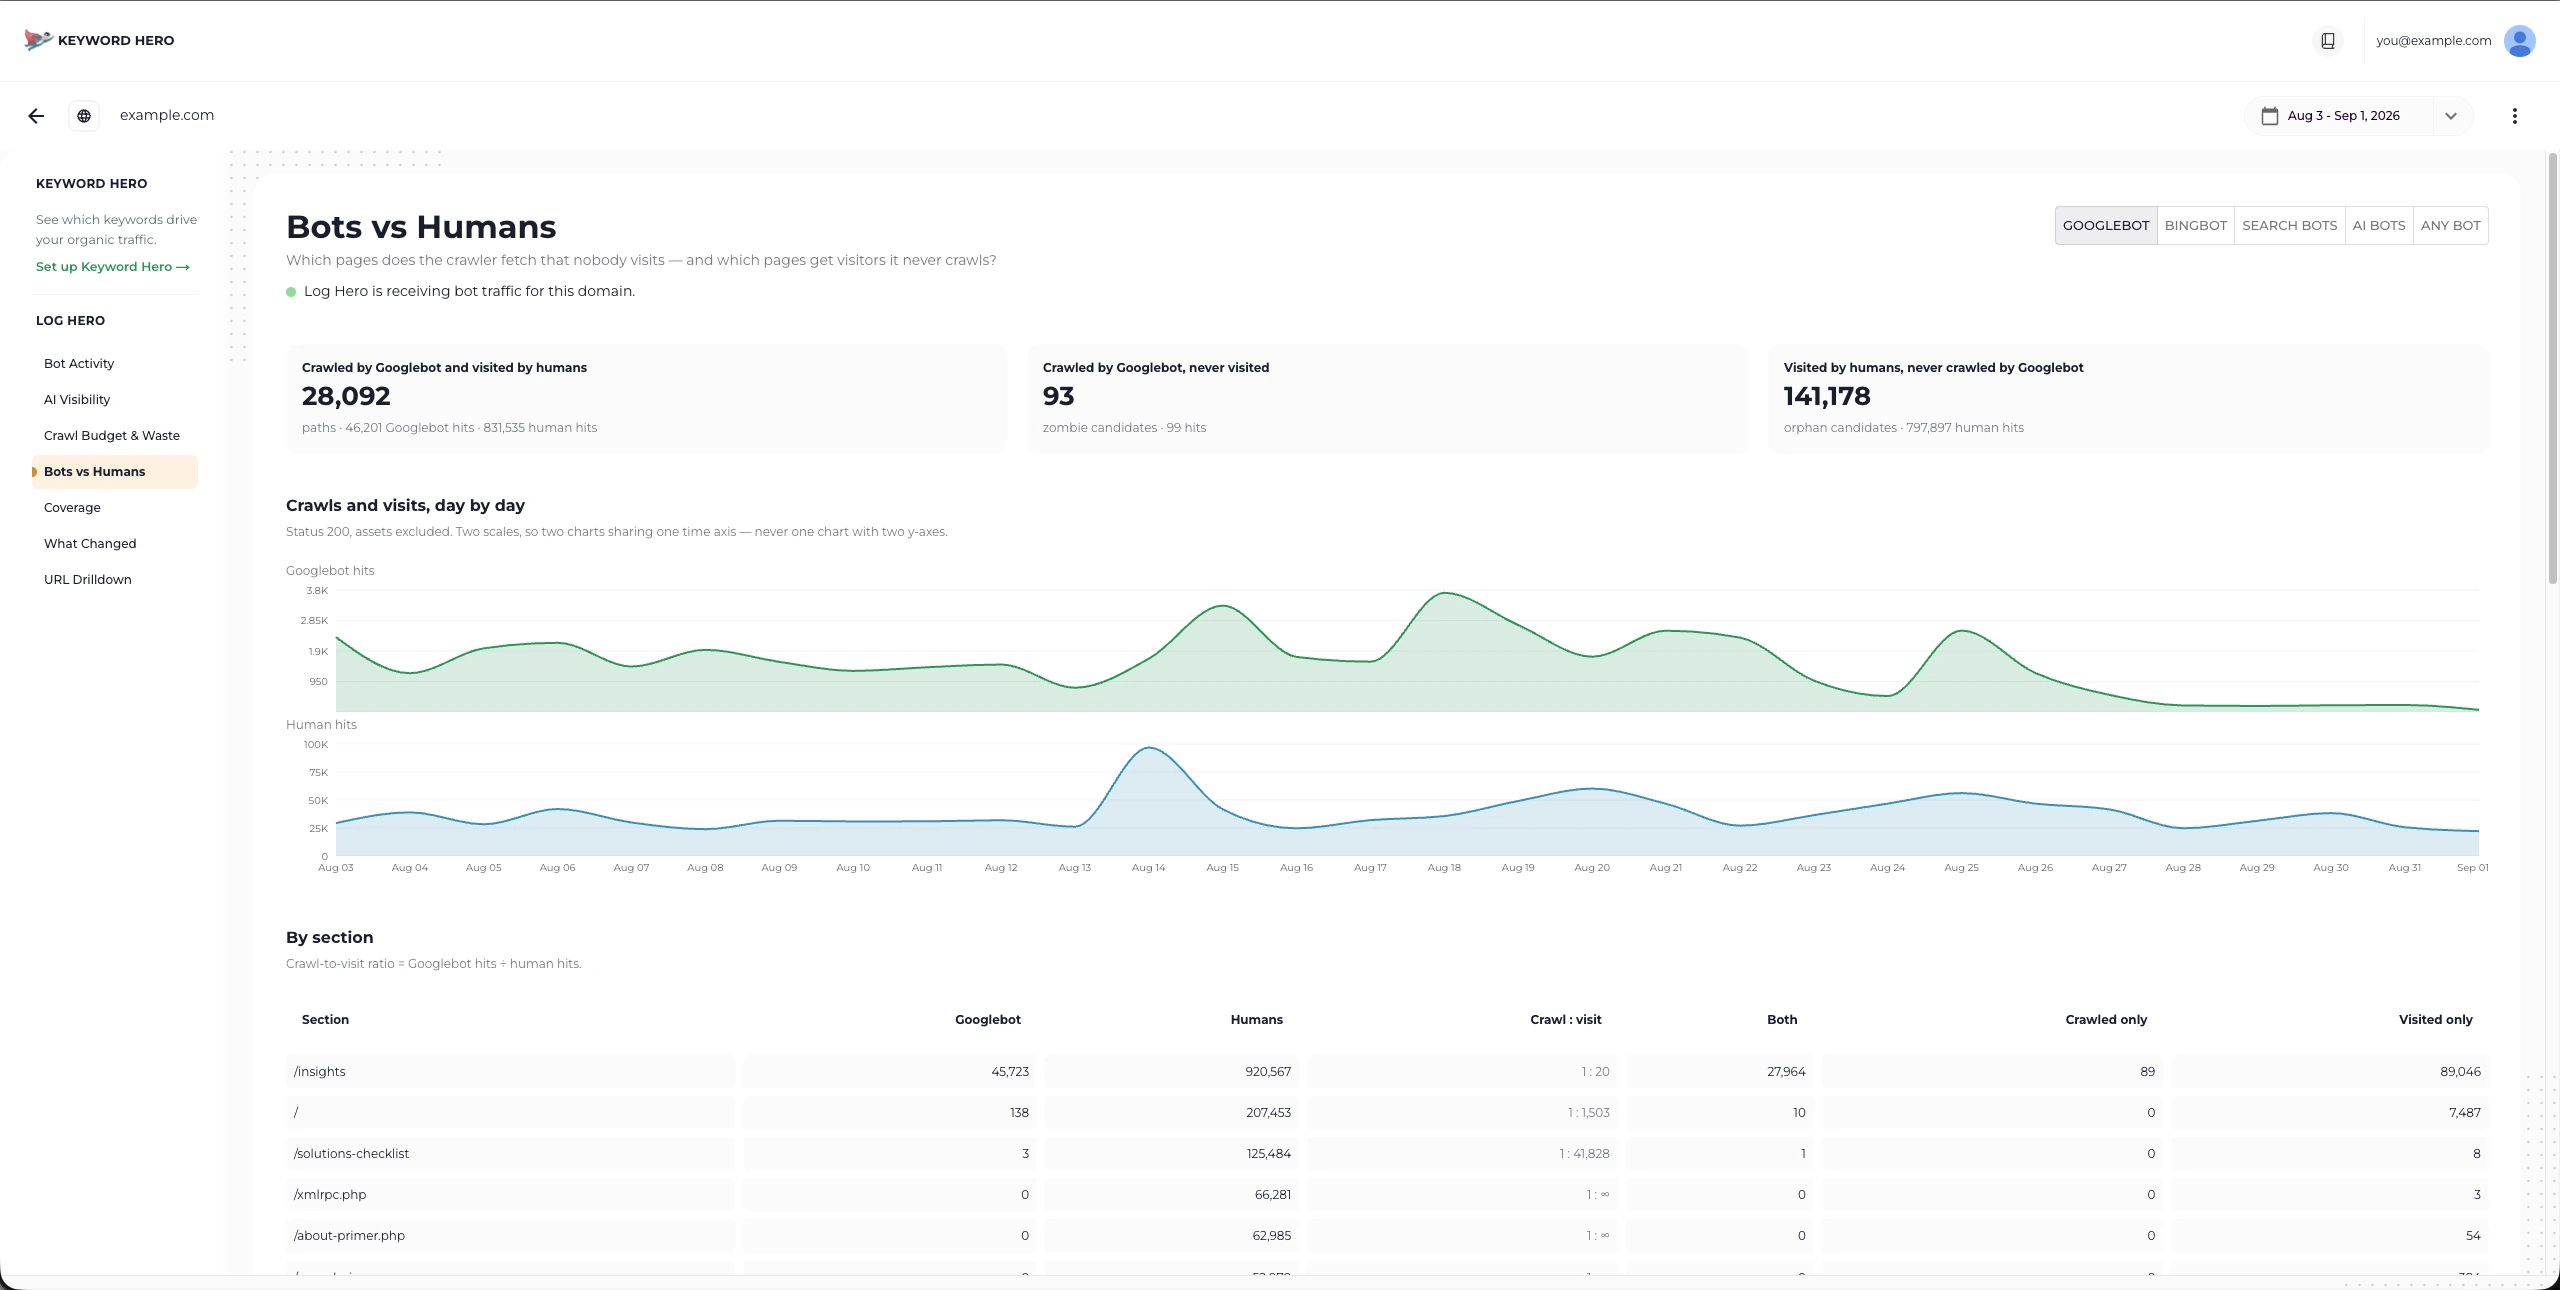
Bots vs Humans. The three tiles count paths, not hits: 100 pages crawled but never visited, 133,051 visited but never crawled.
Two lists, side by side, and they are usually both surprising:
- Crawled, never visited. The crawler keeps fetching pages no one reads.
- Visited, never crawled. People find pages the crawler has not touched.
The second list is the one to act on. A page with human traffic that Googlebot has not fetched in the window is either badly linked internally or blocked somewhere.
“Human” here means every request Log Hero did not classify as a bot. That is a residual category, so login probes and unrecognised crawlers land in it. Treat it as not identified as a bot, not as people.
Coverage
Section titled “Coverage”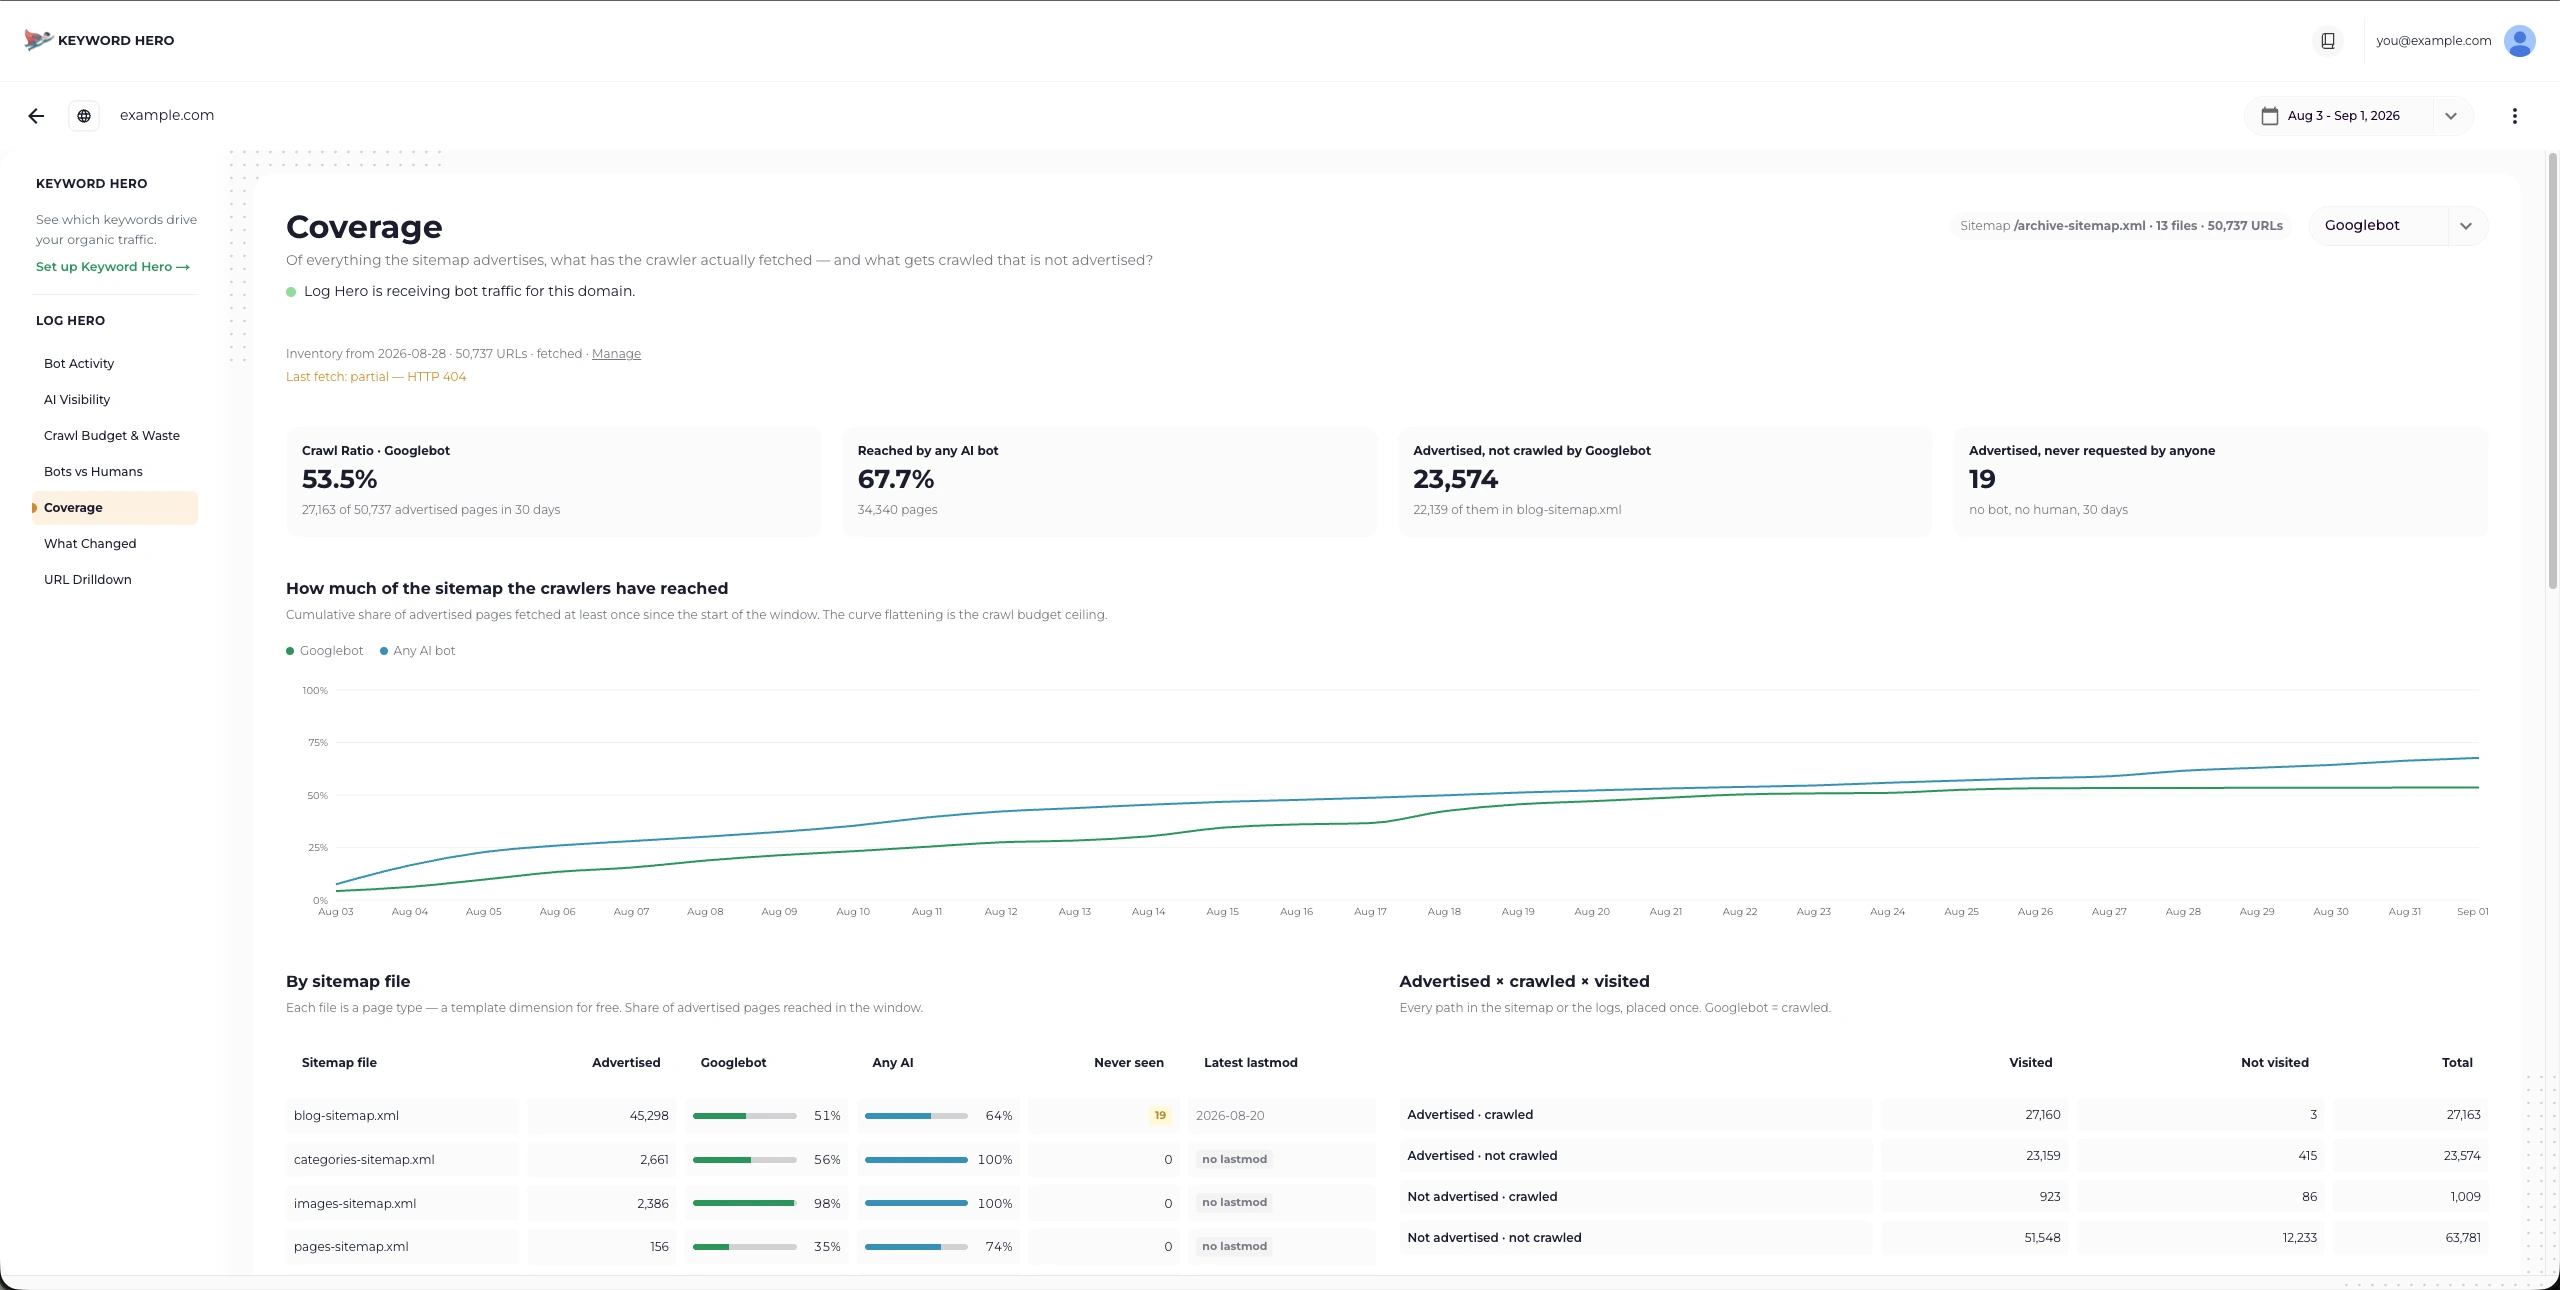
Coverage. Googlebot has reached 53.9% of the advertised pages; note the inventory date and the partial-fetch warning above the tiles.
Needs a sitemap. Add one once under Project settings ▸ Sitemap, either by URL or as an upload, and Log Hero compares what you advertise against what actually gets requested.
You get a crawl ratio per bot, a curve of how much of the sitemap has been reached over time, per-file coverage, and the two gap lists: advertised but never crawled, and crawled but not advertised.
The inventory is a snapshot, not a live fetch — every panel shows the date it was taken. And crawled is not indexed: pair the gap with Search Console before concluding anything.
What Changed
Section titled “What Changed”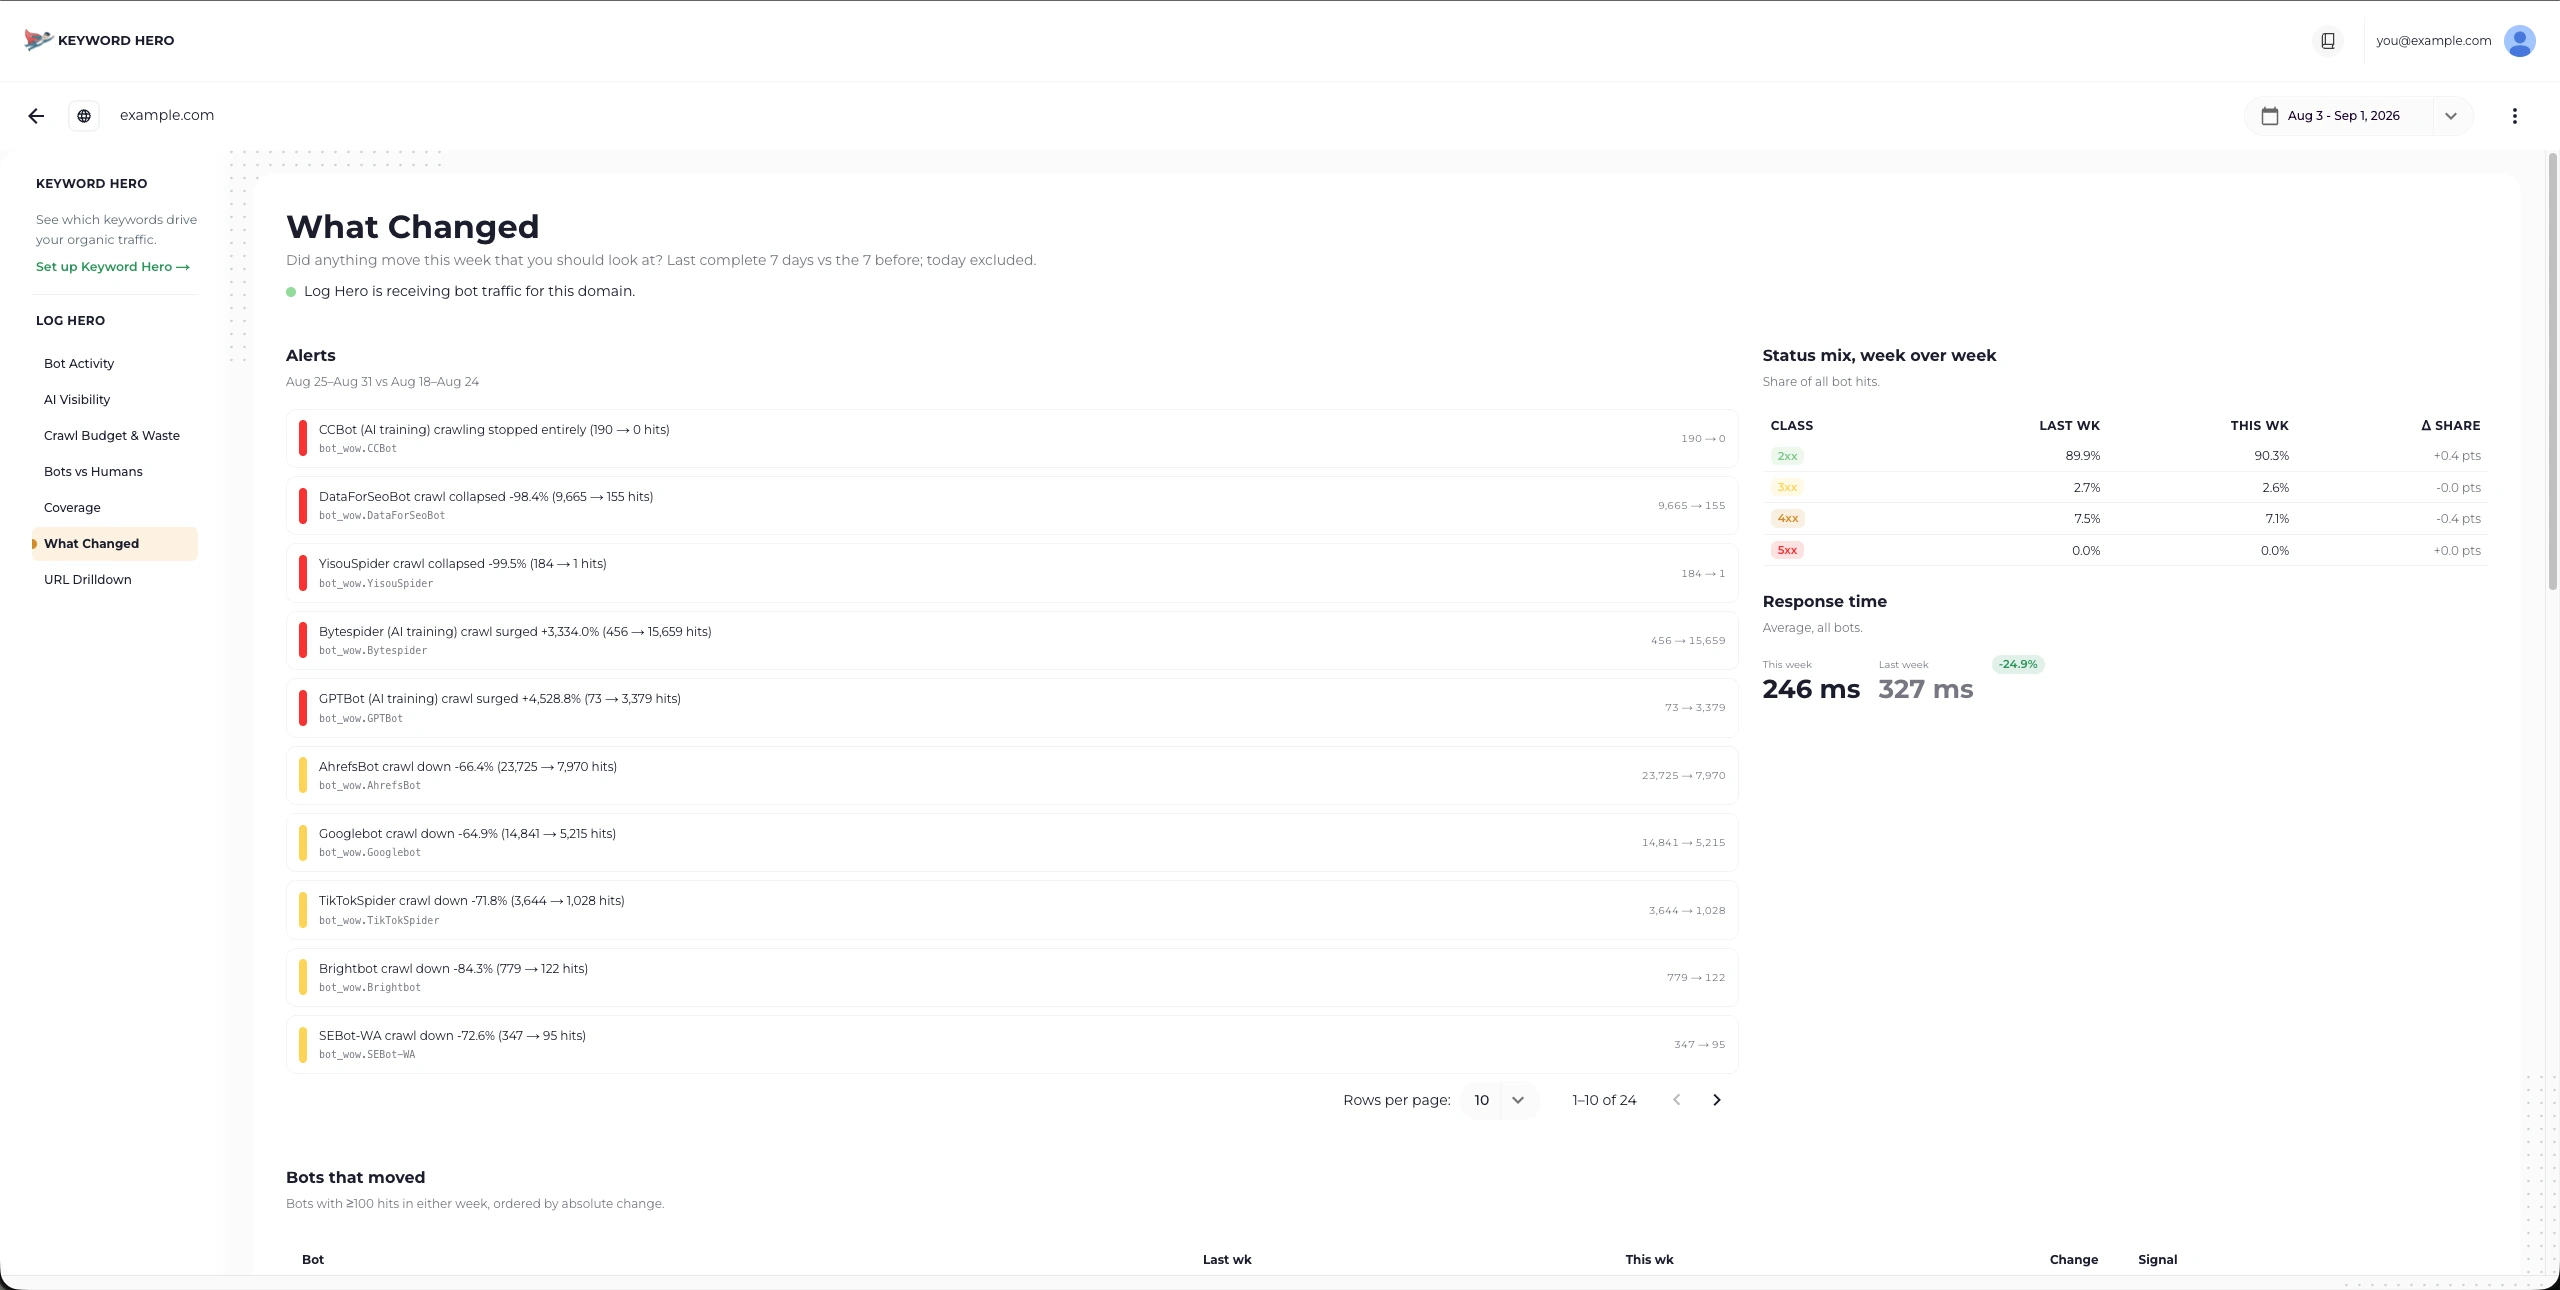
What Changed. Every alert names the bot, the movement and the two hit counts behind it.
The weekly read. Last complete seven days against the seven before, today excluded, with the movements that cleared a threshold called out as alerts: a bot that stopped or surged, a status mix that shifted, response times that slipped, a section suddenly producing 404s.
It also plots crawl volume against response time for Googlebot, which answers a question worth asking once a quarter: does Googlebot back off when your server slows down?
Two weeks is a short baseline. Weekday mix and one-off crawls move these numbers, so read the alerts as prompts rather than verdicts.
URL Drilldown
Section titled “URL Drilldown”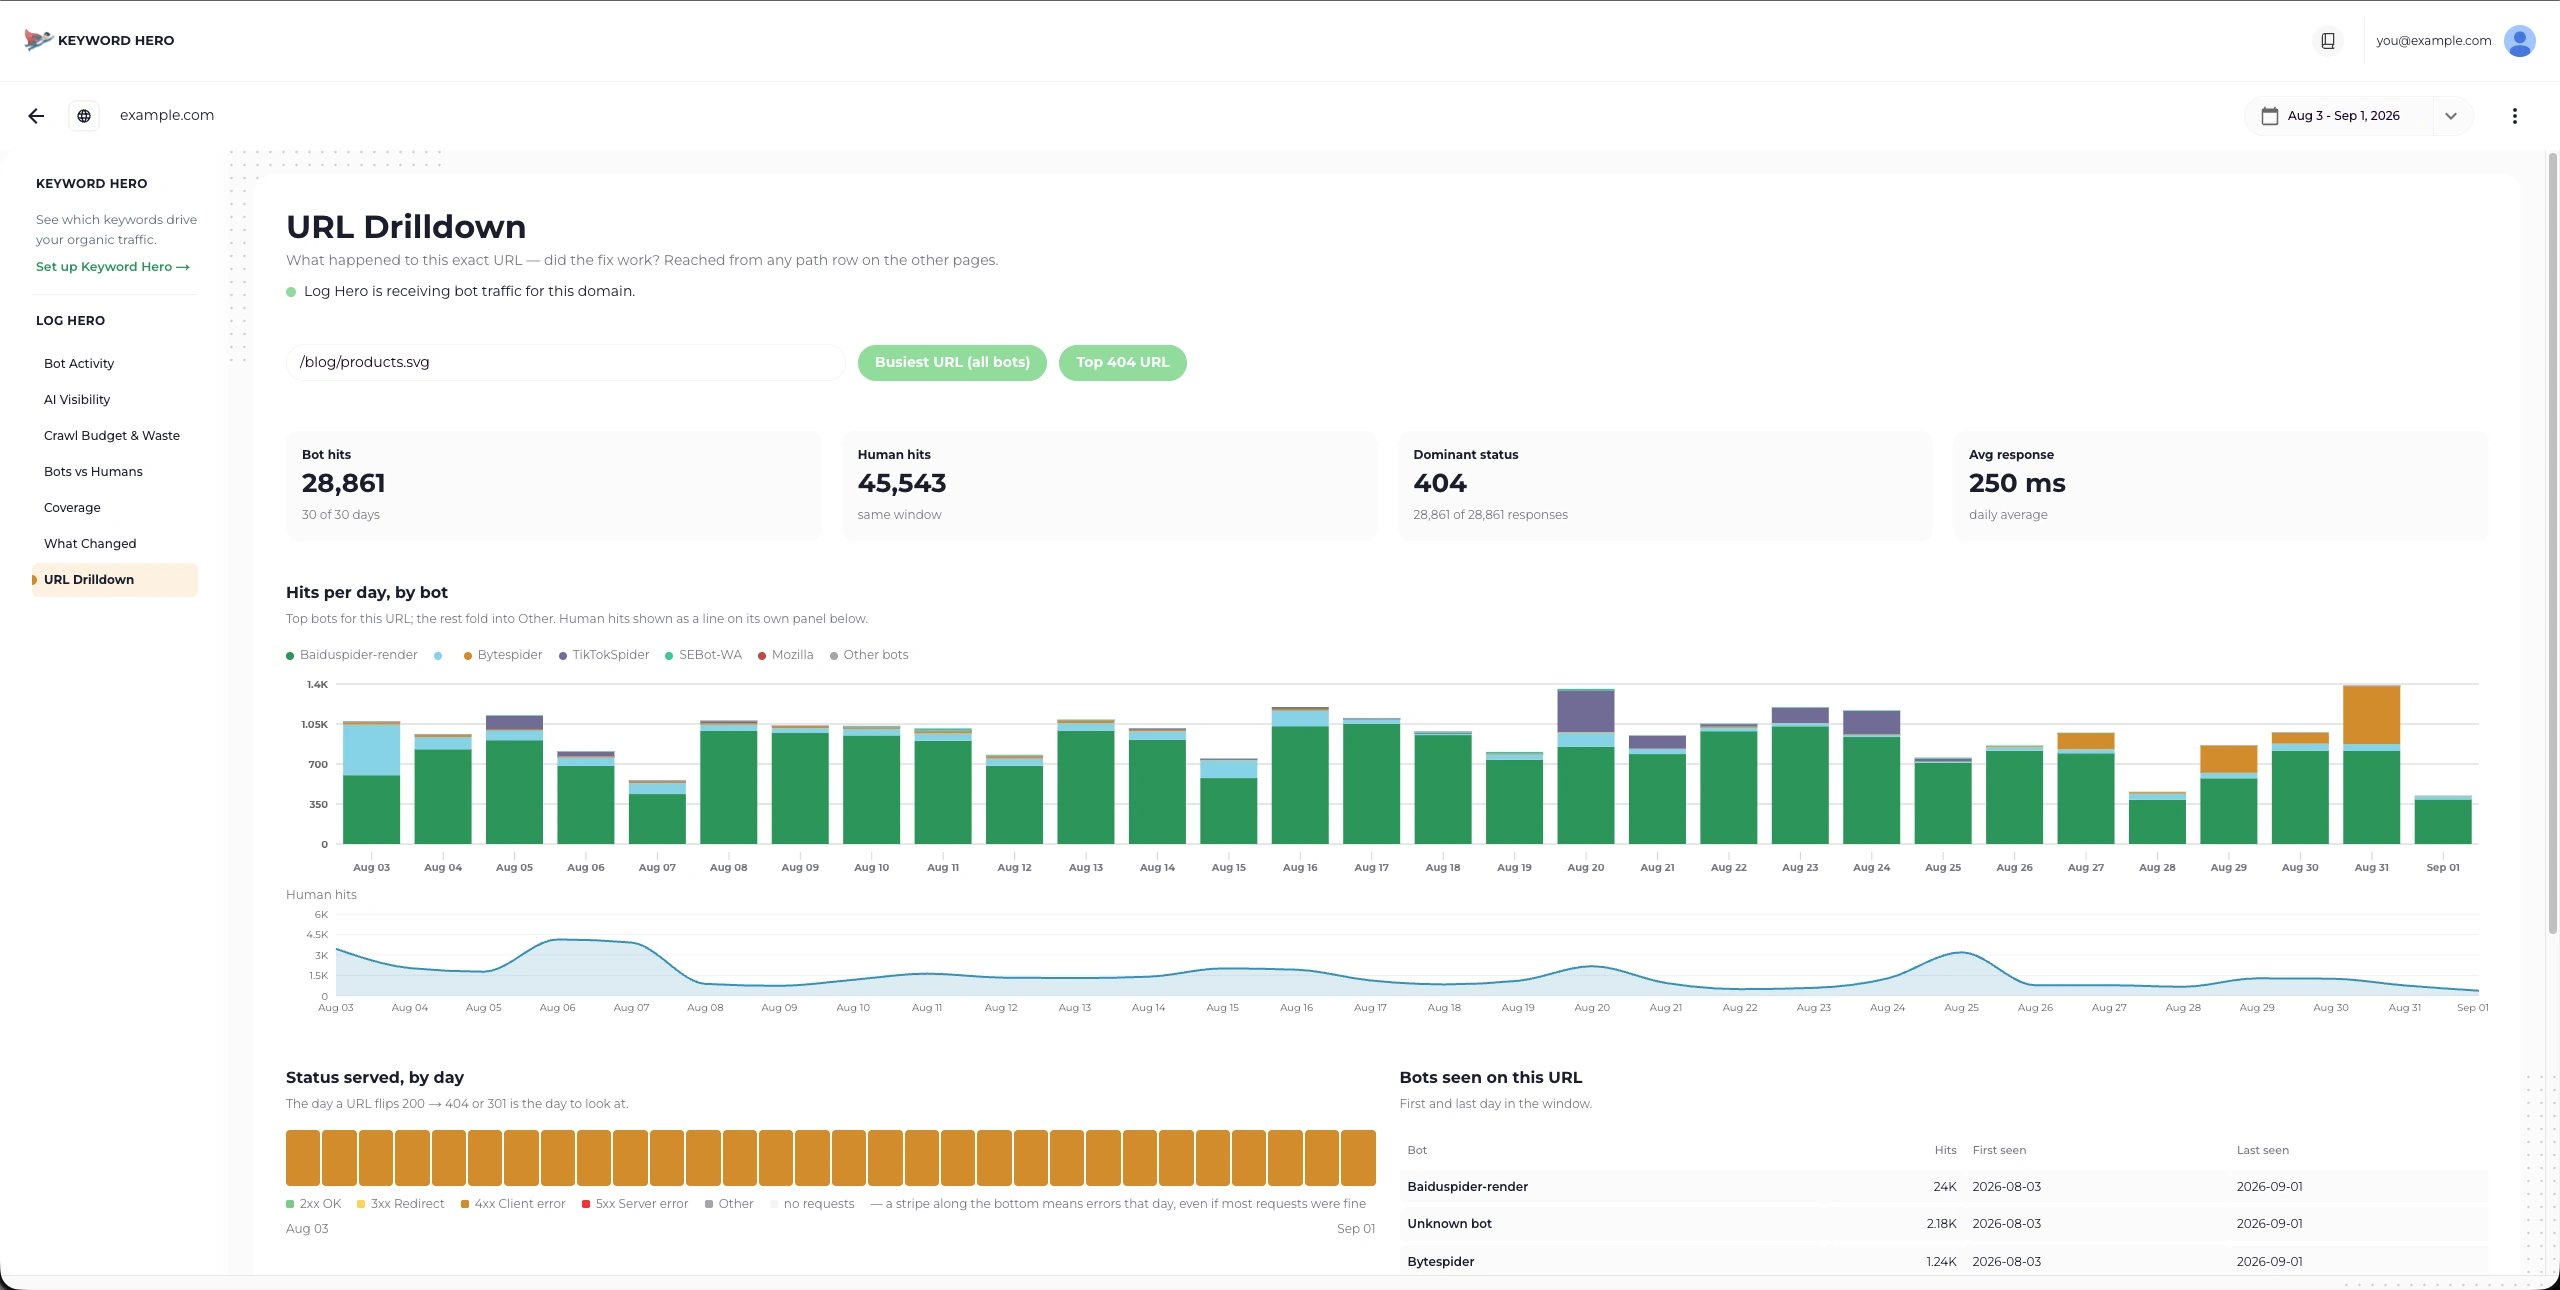
URL Drilldown. This one URL answered 404 to 29,045 bot requests in a month — the kind of thing only a per-URL view makes obvious.
One URL, everything known about it: hits per day by bot, the status served each day with any flips highlighted, which bots have seen it and when they first and last did.
This is the report you use to confirm a fix. Every path row in the other reports links into it, so you rarely open it directly.
What every report shares
Section titled “What every report shares”- Date range and hostname. Both live in the top bar. The hostname selector only appears once Log Hero has seen more than one hostname.
- Today is excluded. Today’s data is still arriving, so charts end yesterday. A missing “today” is not a gap.
- Comparisons are like-for-like. A delta is always against the immediately preceding period of the same length.
- Cached responses may be missing. If your integration collects at the origin, requests your CDN answered from cache never reached it. See Choose your integration.
- Bot names come from your logs. They are what the client claimed, checked against known IP ranges where possible. See How bot verification works.
- Correlation, not causation. Crawl activity and rankings move together often enough to be worth watching and not often enough to be worth trusting.
The same data in GA4
Section titled “The same data in GA4”Everything here also lands in the Google Analytics 4 property Log Hero creates for your domain, as a raw source. The reports are the fast path; GA4 is where you go to combine bot data with the rest of your reporting, or to build something these seven pages do not cover. See GA4 property.
- See which AI bots crawl your site
- Find crawl errors
- Metrics — how every figure above is calculated