
GA4 property
Log Hero does not write into the Google Analytics property you already run. During setup it creates a second GA4 property, in the same Google Analytics account, and sends every request from your server log there.
You recognise it in the account list by the Log Hero prefix in front of your
existing property name.
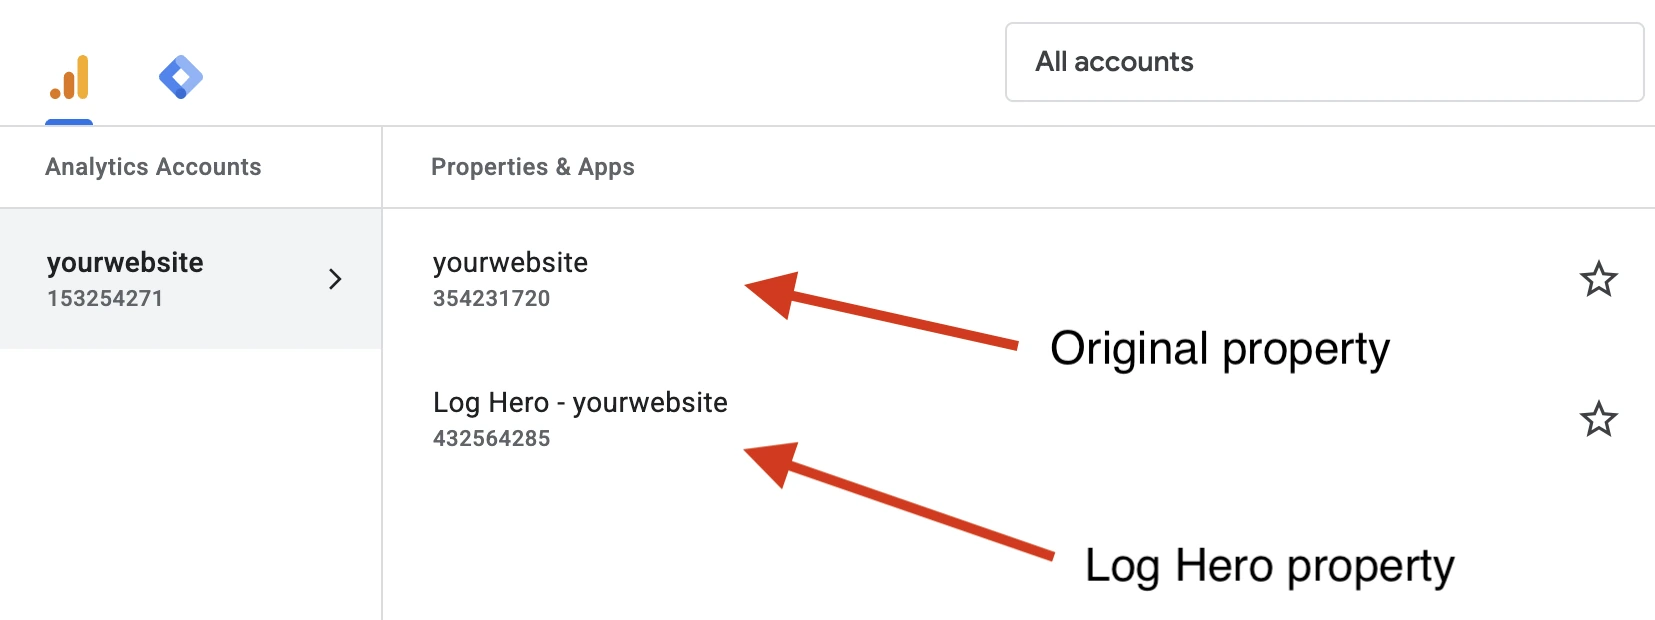
Both properties sit in the same Google Analytics account. The second one is the one Log Hero fills.
Why a separate property
Section titled “Why a separate property”Crawler traffic is not human traffic. If Log Hero pushed a million Googlebot and GPTBot requests into your primary property, every number you rely on there — sessions, users, engagement rate, conversion rate, every audience and every comparison built on top of them — would move, and none of the movement would mean anything about your visitors.
So the bot data goes somewhere else entirely. The separate property exists to avoid any possibility of interfering with your existing data. Log Hero never writes to your primary property, and nothing in your existing reports changes when you switch Log Hero on.
To keep the two comparable, the new property is created as a copy of your existing one: the same timezone, currency, industry category and website URL, and a web data stream named after the one you already have. Day boundaries line up, so a date range means the same thing in both.
What Log Hero creates
Section titled “What Log Hero creates”| Object | What it is |
|---|---|
| GA4 property | Named after your existing property, with Log Hero in front |
| Web data stream | Points at the same website URL as your existing stream |
| Measurement Protocol secret | The credential Log Hero uses to send your log data in |
| 10 custom dimensions | The log fields, listed below |
| 1 custom metric | Page Load Time, in milliseconds |
Requests arrive through the Measurement Protocol — server-side, no tag on your site, no JavaScript. That is what makes it possible to report on visitors who never execute JavaScript in the first place, which is exactly what a crawler is.
Custom dimensions
Section titled “Custom dimensions”Every request Log Hero sends carries the fields from your log line as event parameters. The property registers each of them as an event-scoped custom dimension, so you can use them as dimensions, filters and secondary dimensions anywhere in GA4.
| Dimension | Event parameter | What it holds |
|---|---|---|
| Bot IP | bot_ip |
The IP address the request came from — the address bot verification is run against |
| Bot Name | bot_name |
The crawler Log Hero resolved the request to: Googlebot, GPTBot, ClaudeBot and so on. Unresolved crawlers are grouped as Unknown bot |
| Is Bot | is_bot |
Whether the request was classified as bot traffic at all |
| Method | method |
The HTTP method: GET, HEAD, POST … |
| Official Bot | official_bot |
Whether the claimed bot passed verification — that the IP really belongs to the operator it says it does |
| Protocol | protocol |
The protocol the request used, for example HTTP/1.1 or HTTP/2 |
| Spam Bot Type | spam_bot_type |
Set when a request claims to be a known crawler but the IP does not back that up |
| Status Code | status_code |
The status your server returned: 200, 301, 404, 500 … |
| Timestamp | timestamp |
When the request hit your server |
| User Agent | user_agent |
The raw, unparsed User-Agent string |
Alongside them sits one custom metric, Page Load Time (page_load_time),
recorded in milliseconds — how long your server took to serve that request.
You reach all of them the same way as any GA4 dimension: open the dimension picker in a report or exploration and look under Custom.
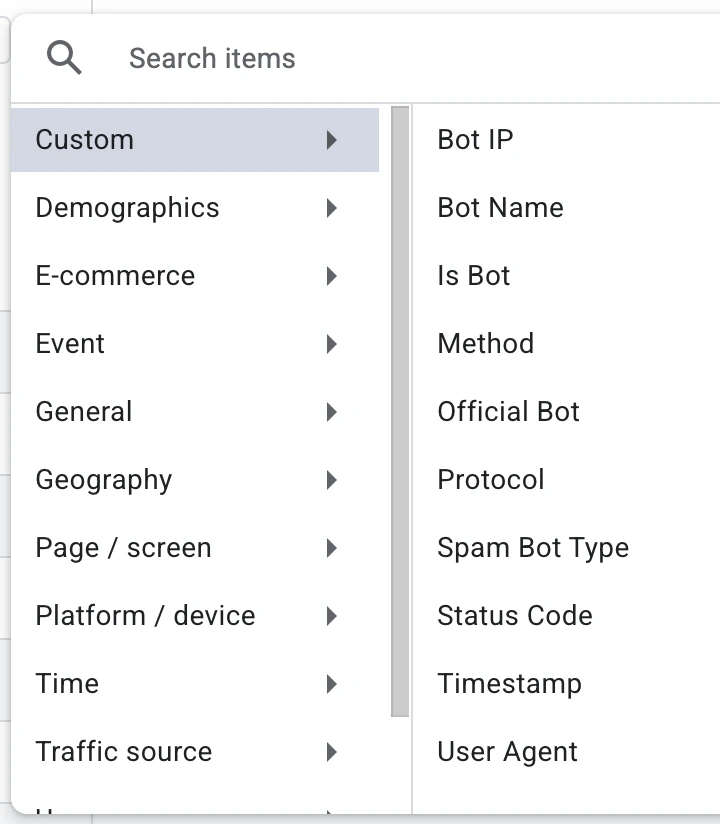
The ten Log Hero dimensions, in the dimension picker under Custom.
Two things follow from these being event-scoped custom dimensions:
- GA4 matches them by event parameter name, not by the label you see. You can rename the display name without breaking anything; the parameter names in the middle column are the ones that matter.
- They start empty. A custom dimension only shows values for events recorded after it existed, so the first day or two can look sparse even when data is clearly arriving.
For what each field means in a report — and how the same fields drive the Log Hero reports themselves — see Metrics and the Bot catalogue.
Before you start
Section titled “Before you start”Creating a property is an account-level operation in Google Analytics. Editor rights on your existing property are not enough: Log Hero needs edit permission at account level. You can check this in Google Analytics under Admin → Account access management.
If the account you pick is out of property slots, or you do not have edit rights on it, the wizard says so and offers you a different account — the Log Hero property does not have to live in the same account as your original property, though keeping them together is easiest.
Two ways in
Section titled “Two ways in”Both start on Your domains.
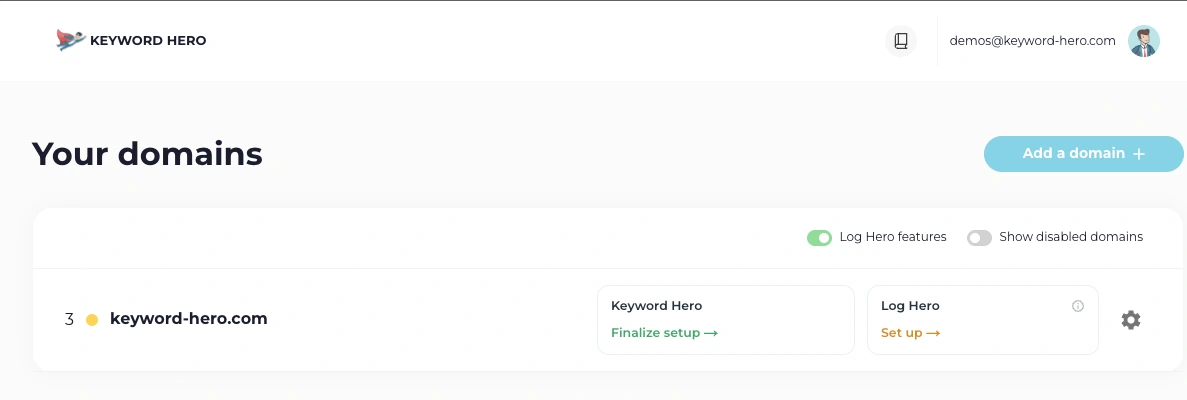
If the domain is already in your account, use the Set up link on the Log Hero card in that domain’s row:
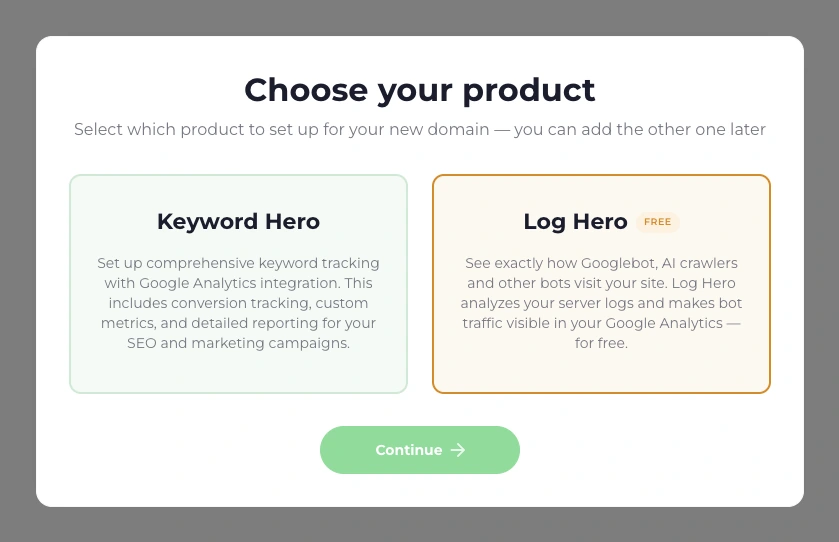
If it is a new domain, use Add a domain, then choose Log Hero:
Choose the property to mirror
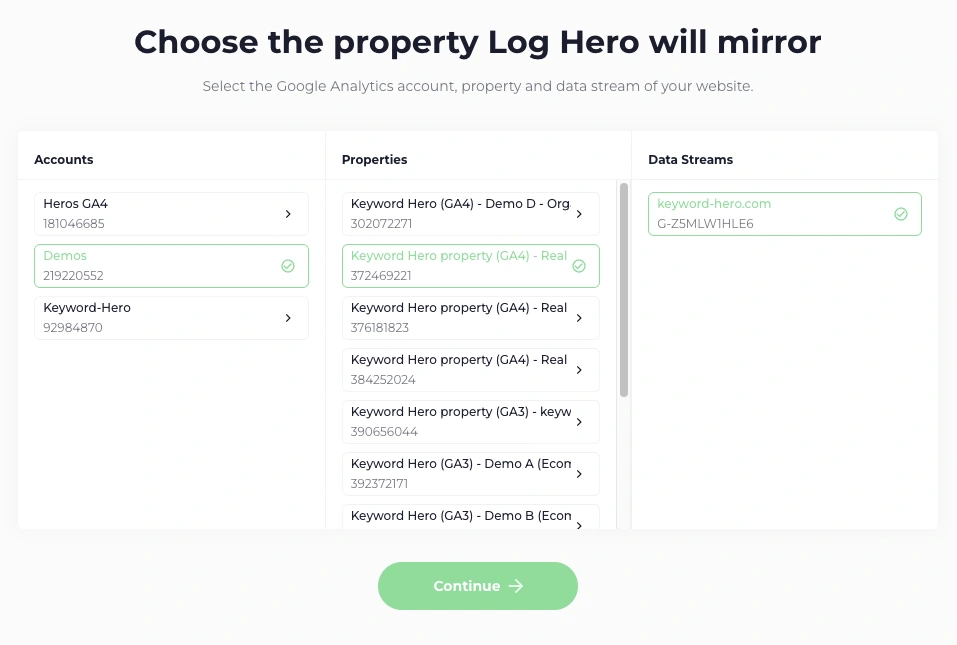
Section titled “Choose the property to mirror”Pick the Google Analytics account, property and data stream of the site whose logs you are about to send. This is your existing property — the one Log Hero copies its settings from, not the one it will write to.
Create it
Section titled “Create it”The last screen is a summary of what is about to be created. The Change link next to Google Analytics account is where you move the new property to a different account if you need to.
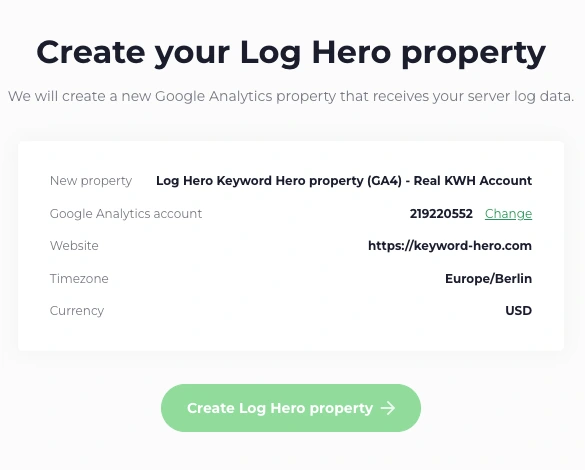
Press Create Log Hero property and Log Hero does the rest: the property, the data stream, the Measurement Protocol secret, the ten custom dimensions and the custom metric, in one step. It also accepts Google’s user-data collection acknowledgement for the new property on your behalf.
From here you continue with the integration that actually ships the logs — see Choose your integration, or the Quickstart for the whole path end to end.
Using the GA4 property
Section titled “Using the GA4 property”Once your integration is sending, the fastest way to see the requests in Google Analytics is Life cycle → Engagement → Pages and screens:
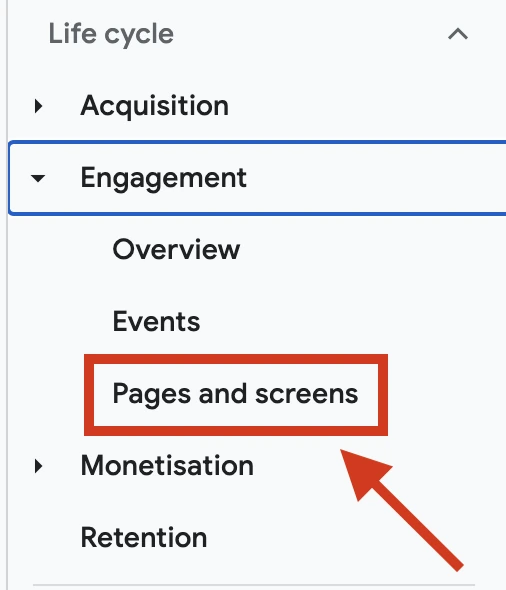
That gives you your URLs with the hit counts behind them. Add Bot Name, Status Code or Official Bot as a secondary dimension and you have a crawl report: which crawler, on which URL, getting which answer.
A few practical notes:
- Standard GA4 reports lag. New data can take up to 24 hours to appear in them. Realtime shows it much sooner, and it is the better place to look when you have just finished setup.
- To confirm your integration works at all, don’t wait on GA4. The Log Hero dashboard is the quicker signal — see Verify your setup.
- Explorations are where this data gets interesting. The custom dimensions are event-scoped, so they combine freely in a free-form exploration: Bot Name against Status Code, Official Bot against Bot IP, Page Load Time by URL.
What not to change
Section titled “What not to change”- Do not delete the property. Log Hero addresses it by property ID. Delete it and ingestion stops; it has to be set up again from scratch.
- Do not delete the custom dimensions. Values still arrive, but GA4 has nowhere to put them, so they stop being reportable. Renaming their display names is fine.
- Do not add a website tag to its data stream. The stream carries server log data only. Tagging your site into it would mix human page views in and defeat the point of the split.
- It counts against your account’s property limit. Worth knowing if the same Google Analytics account is close to full.