
Metrics
Every figure in the Log Hero reports is defined here: what goes into the numerator, what goes into the denominator, and what a delta is measured against.
What a hit is
Section titled “What a hit is”One hit is one request your integration recorded — one line in your server log, with the fields Anatomy of a log line walks through. Requests are stored already grouped by day, so every figure is a sum of hit counts rather than a count of rows. Two consequences worth knowing:
- The finest granularity is a day. There is no hourly view, and there cannot be one from this data.
- Today is excluded. Today’s data is still arriving, so every chart and every figure ends yesterday.
Rules that apply everywhere
Section titled “Rules that apply everywhere”- Log Hero’s own crawler is excluded.
KeywordHeroBotis filtered out of every figure, human-side ones included. - Deltas compare like with like. A delta is always against the immediately preceding period of the same length. Seven days selected means the seven days before that, labelled vs previous 7 days.
- A hostname filter, once there is more than one. The selector appears in the top bar as soon as Log Hero has seen a second hostname.
- Assets are included unless a metric says otherwise. Images, CSS and JavaScript are requests like any other.
- An unnamed bot is still a bot. Requests whose User-Agent Log Hero could not resolve to a known name are grouped as Unknown bot and counted.
Bot Activity
Section titled “Bot Activity”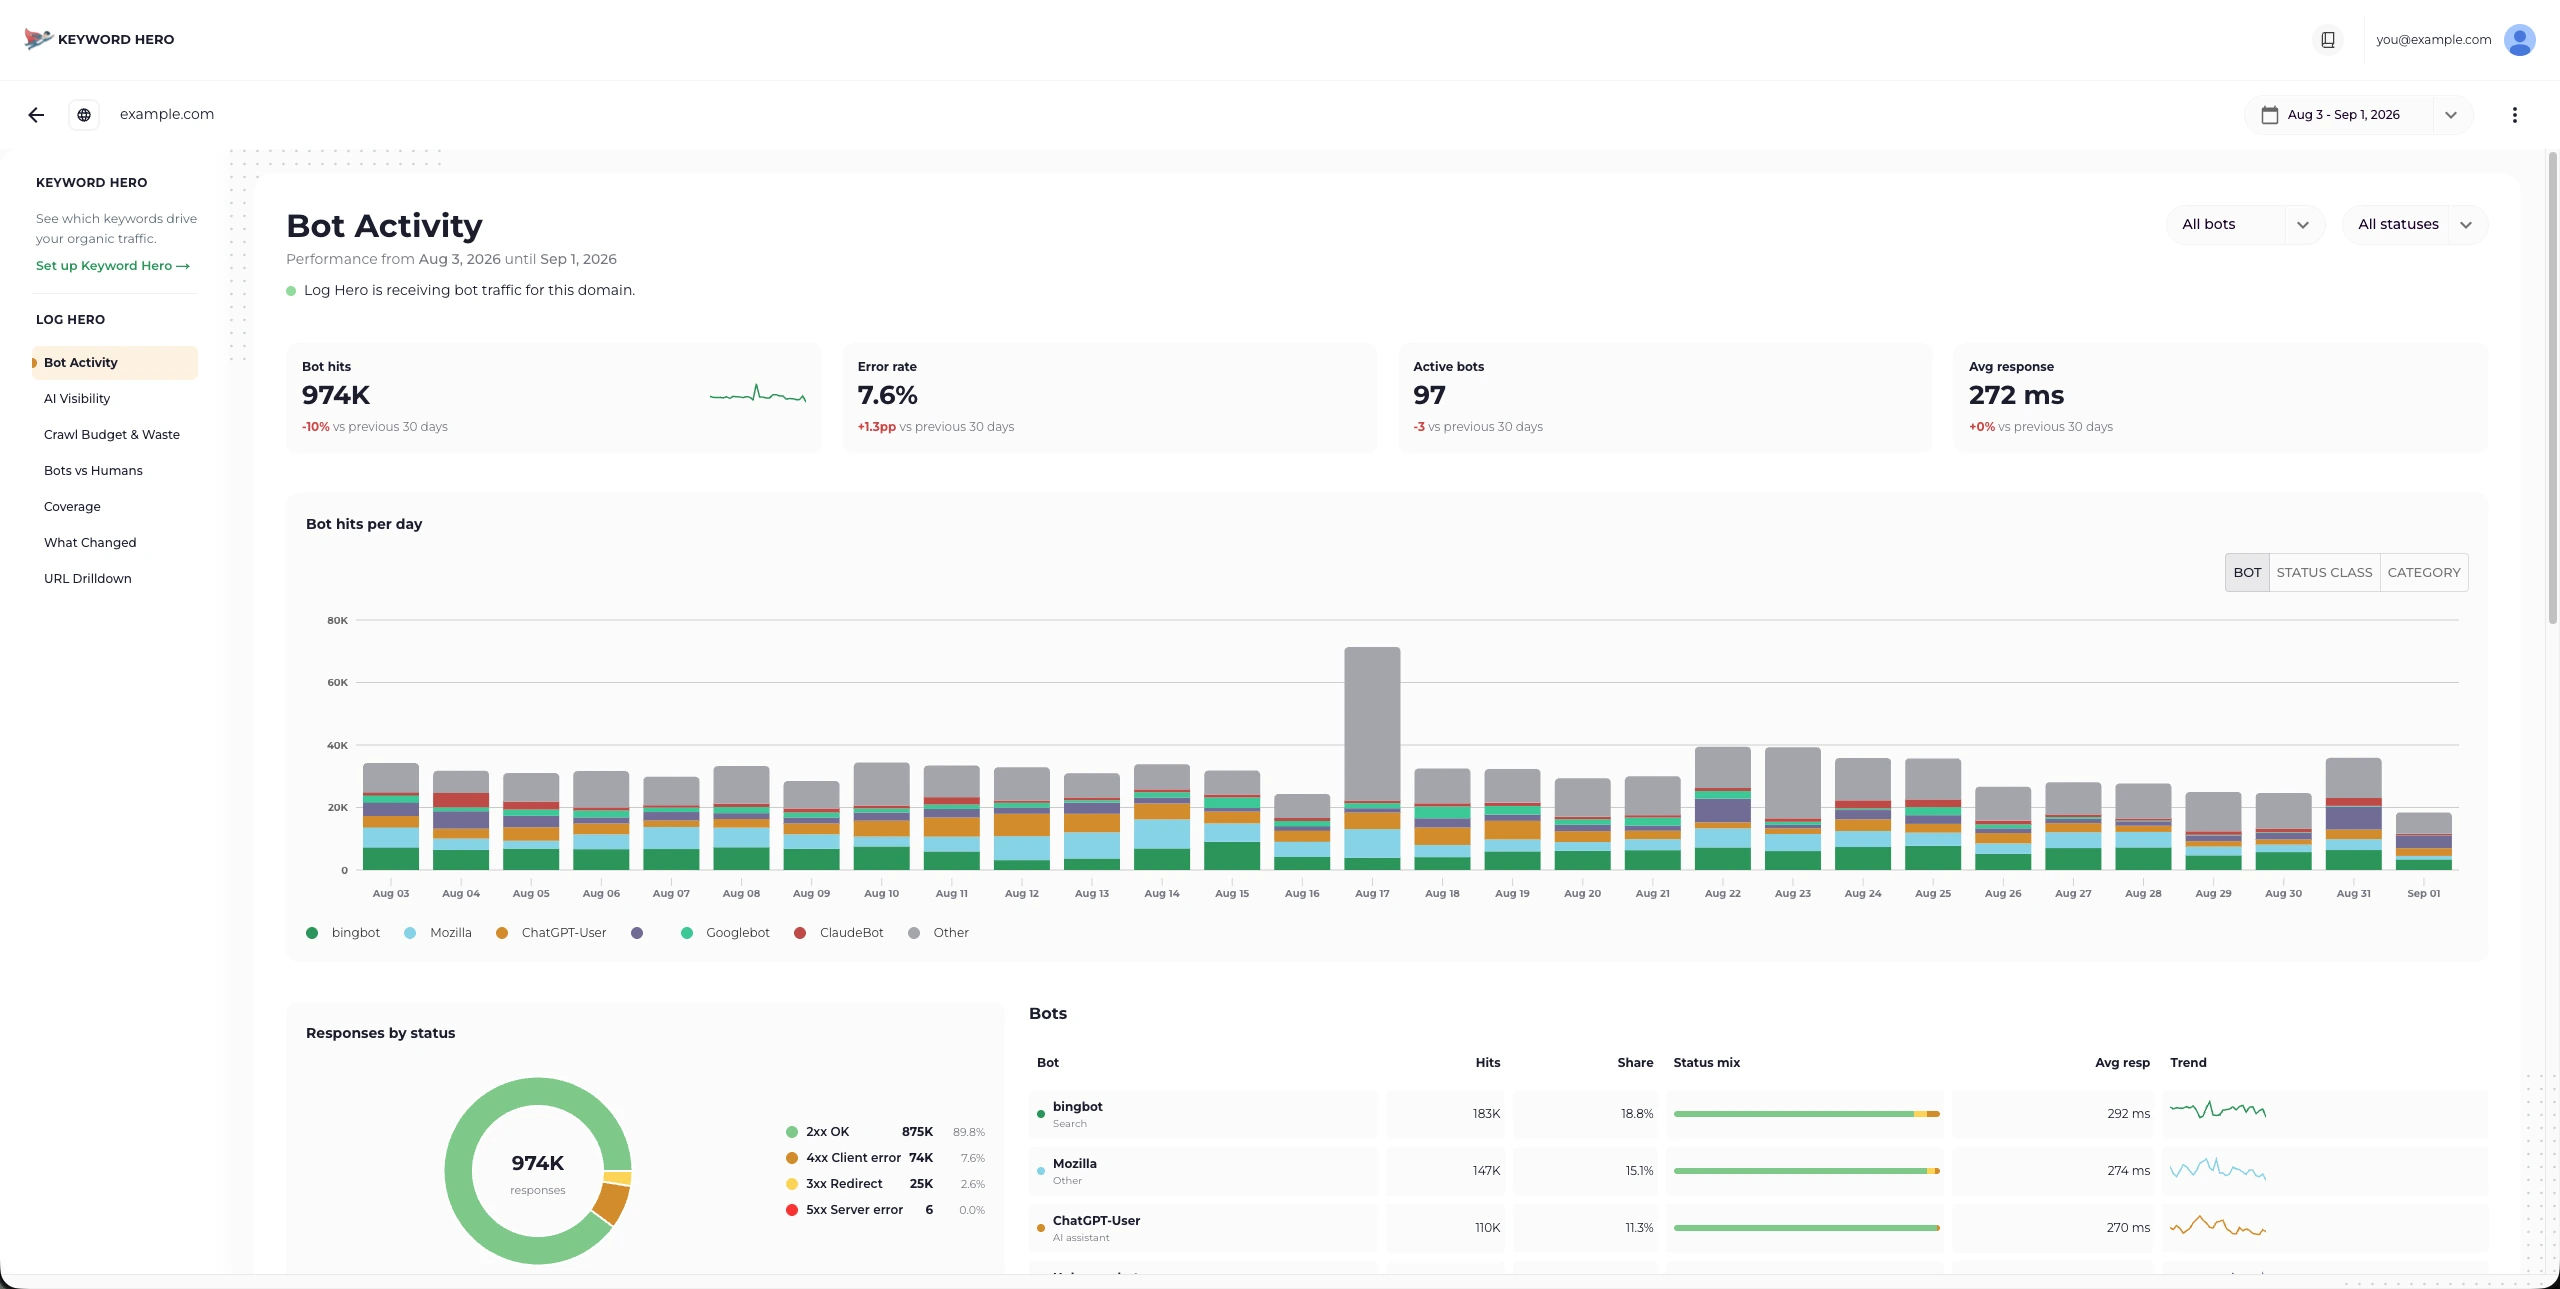
Bot Activity. Note the units in the deltas: percent for hits and response time, percentage points for the error rate, a plain count for active bots.
| Metric | How it is calculated | Its delta |
|---|---|---|
| Bot hits | Sum of bot hits in the window | Percent change |
| Error rate | Hits with a status of 400–599, divided by all bot hits. 3xx is not an error | Percentage points |
| Active bots | Distinct bot names with at least one hit. No minimum | Absolute difference |
| Avg response | Total response time divided by total requests measured — a hits-weighted mean, not an average of daily averages | Percent change |
The four tiles follow the selected bot, but not the selected status class: filtering the page to 4xx does not turn Bot hits into a count of 4xx hits.
AI Visibility
Section titled “AI Visibility”An AI bot here means a bot categorised as AI training or AI assistant. Googlebot and bingbot are search bots and are not counted as AI.
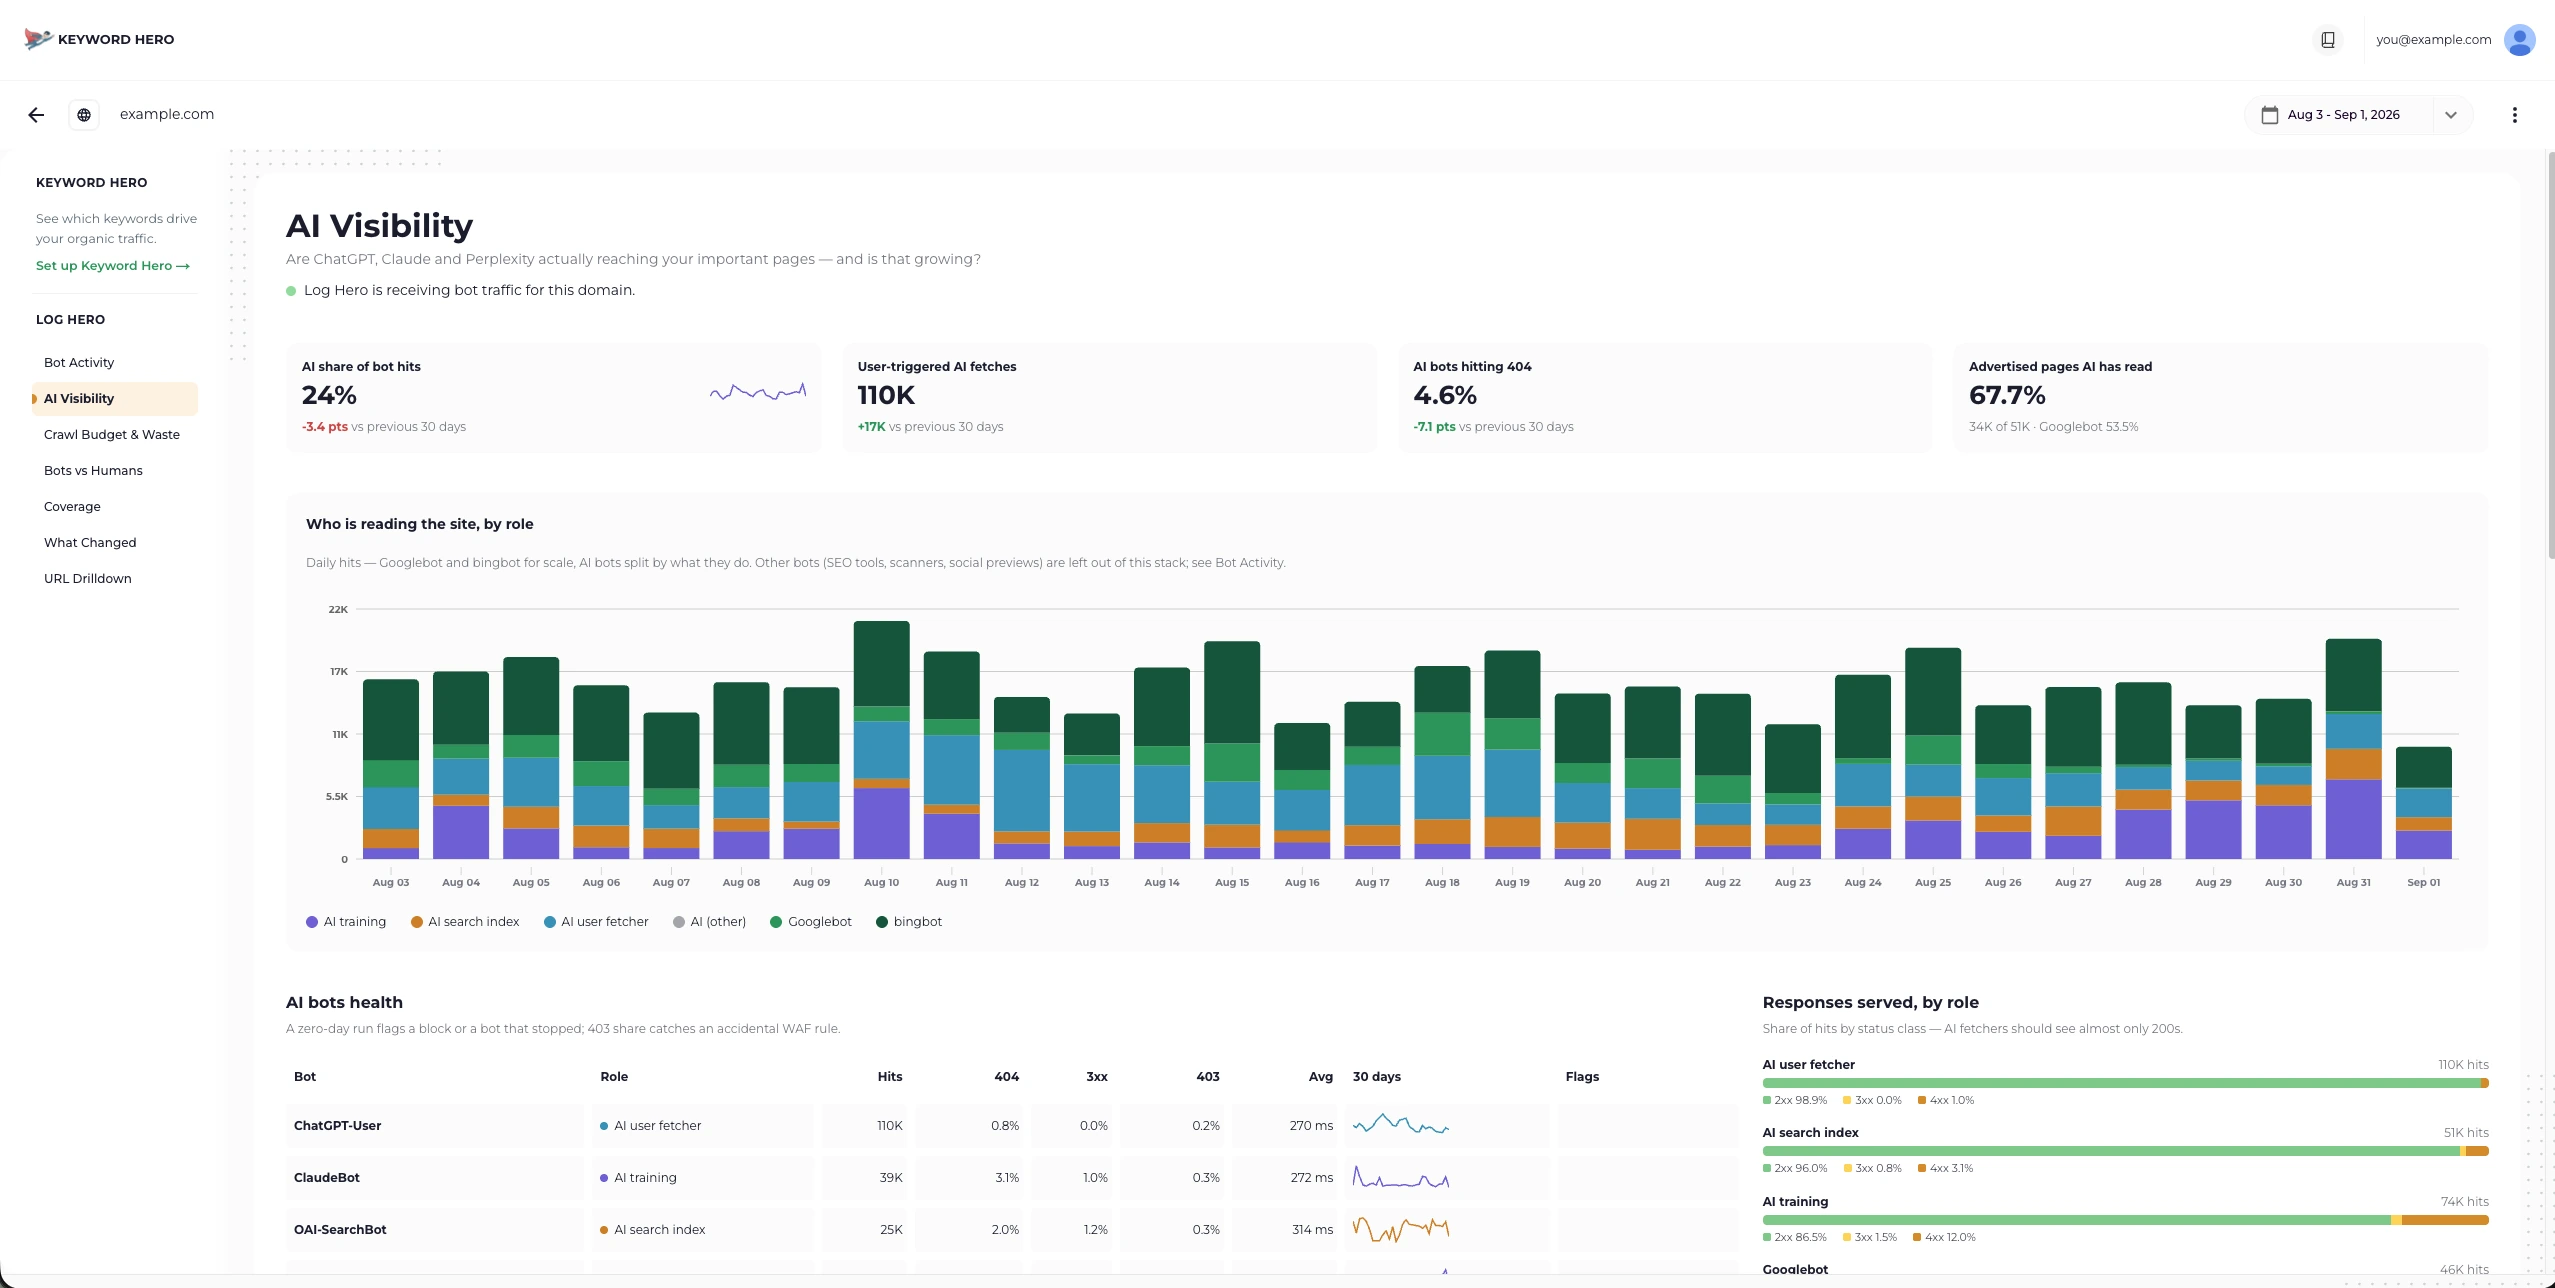
AI Visibility. The fourth tile only appears once a sitemap inventory exists.
| Metric | How it is calculated | Its delta |
|---|---|---|
| AI share of bot hits | AI-bot hits divided by all bot hits | Percentage points |
| User-triggered AI fetches | Hits from bots in the user-fetcher role — ChatGPT-User, Perplexity-User and the like | Absolute difference |
| AI bots hitting 404 | AI-bot hits with status 404 exactly, divided by all AI-bot hits. Other 4xx are not counted here | Percentage points |
| Advertised pages AI has read | Sitemap URLs with at least one hit from an AI bot, divided by all sitemap URLs | None |
| AI avg response | As Avg response, over AI-bot rows only | Absolute, in ms |
Crawl Budget & Waste
Section titled “Crawl Budget & Waste”This report is per bot, and two of its figures come from a sample: the 5000 most-requested URLs in the window, not every URL. On a site with fewer than 5000 crawled paths the sample is the whole thing.
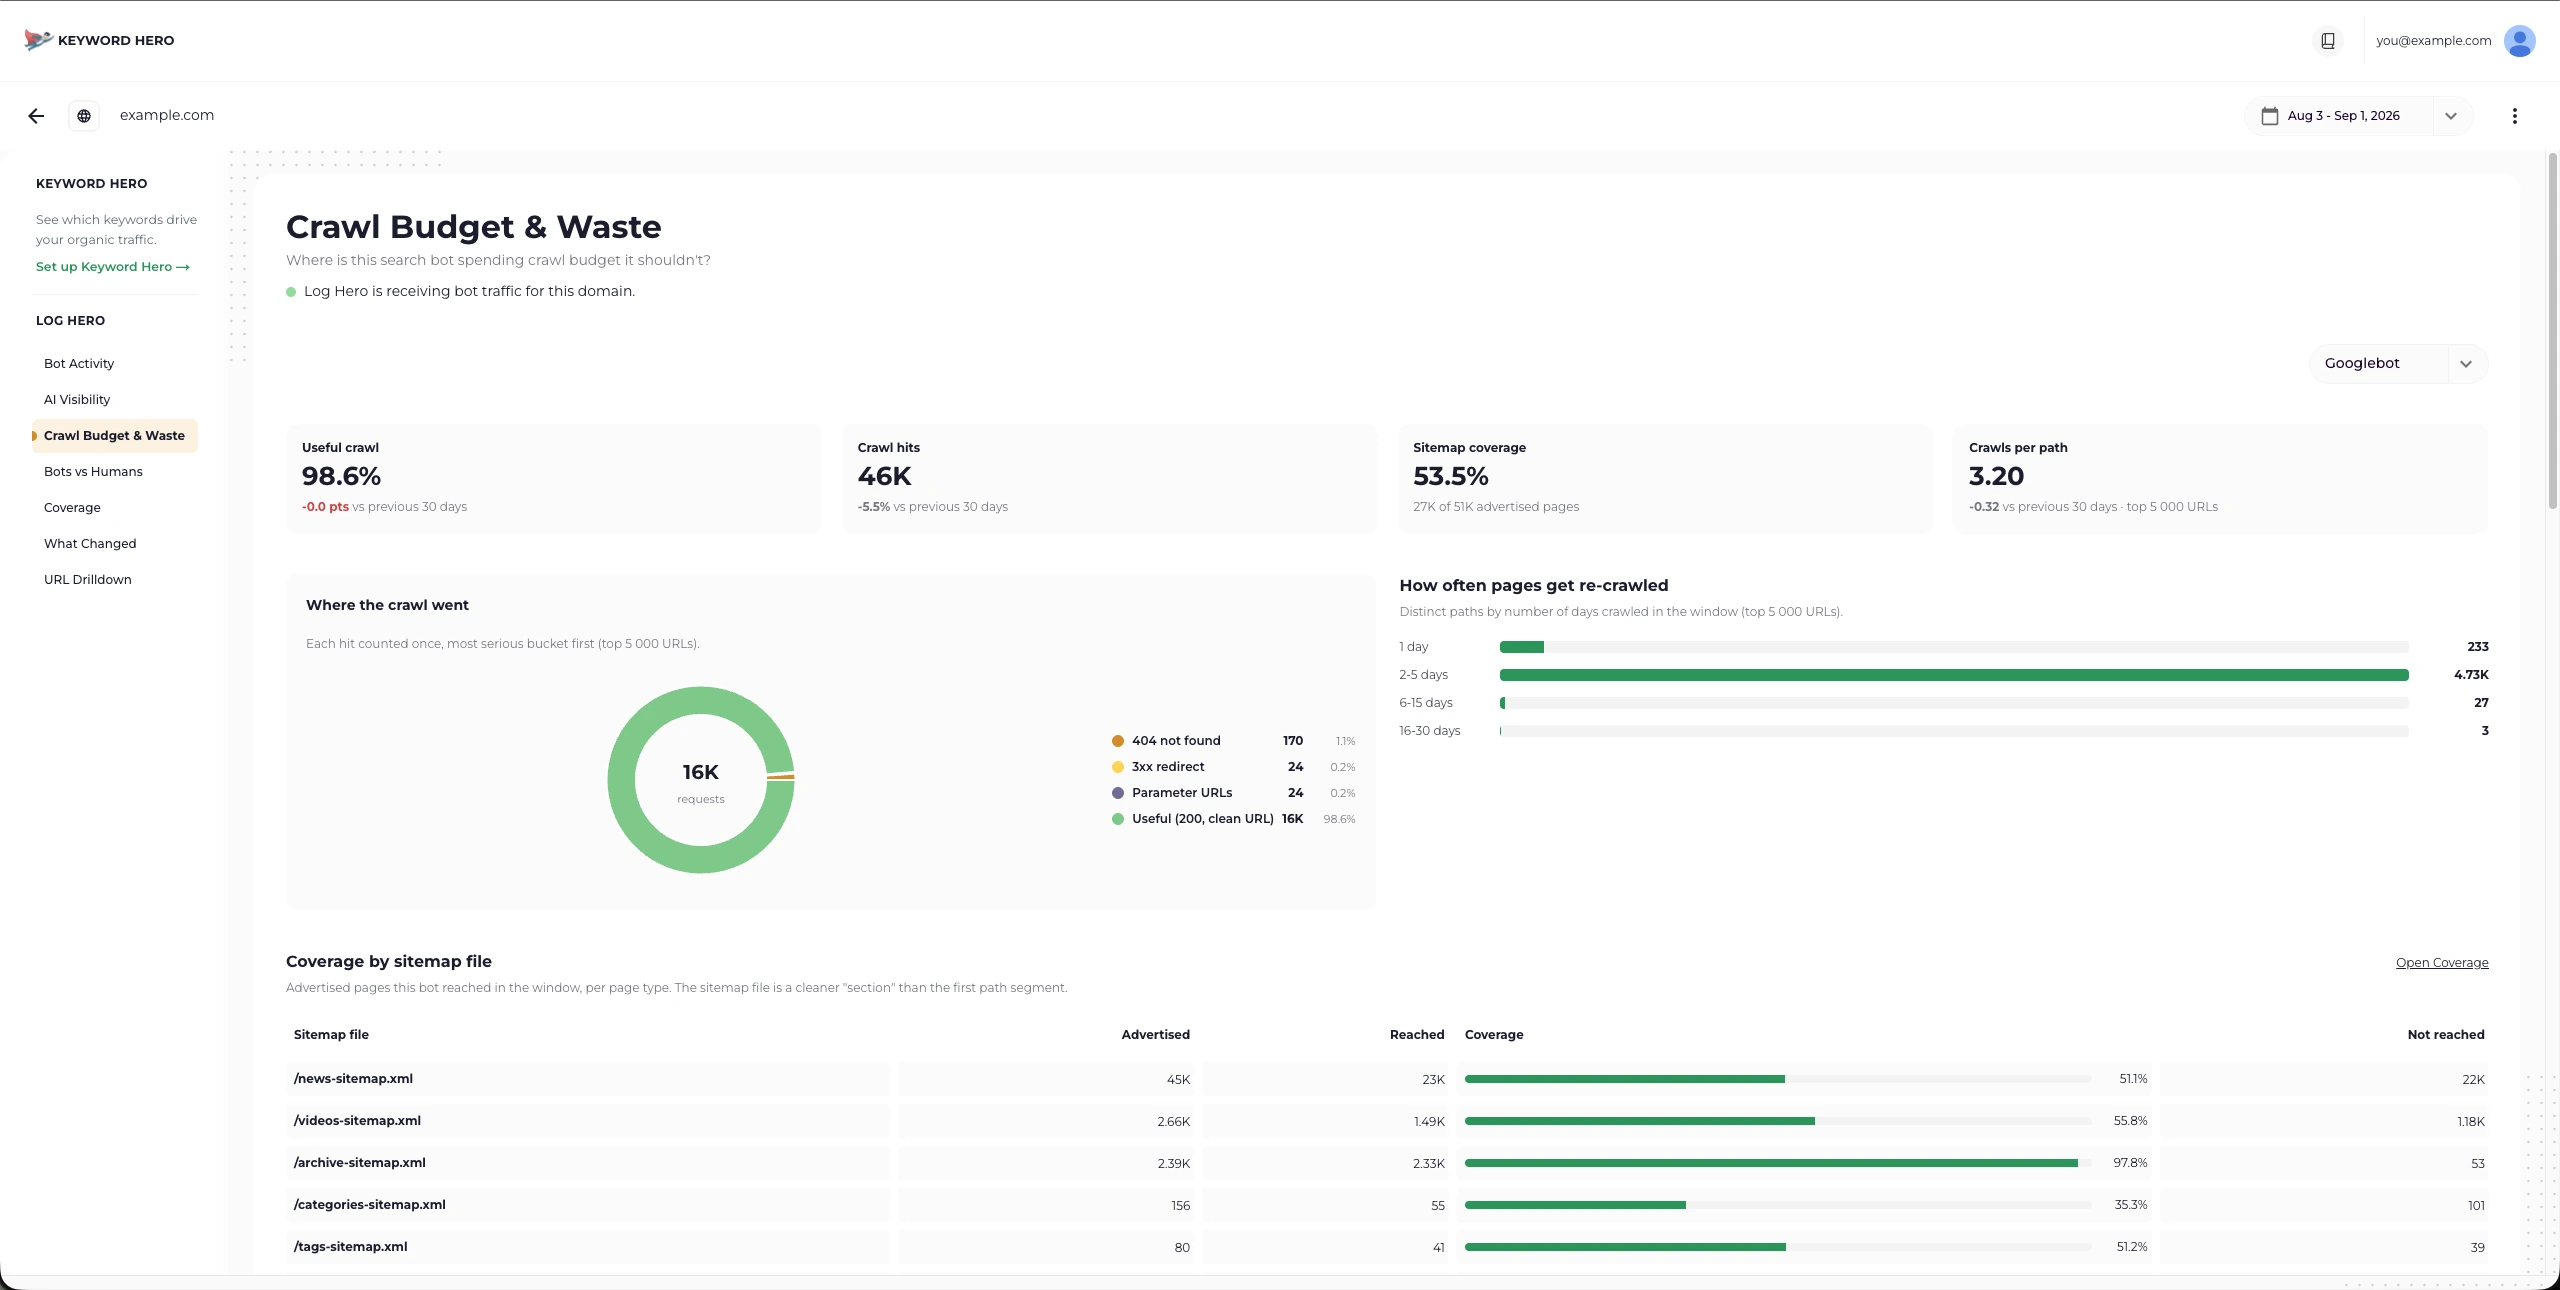
Crawl Budget & Waste. The hints under the tiles say which figures are sampled: “top 5 000 URLs”.
| Metric | How it is calculated | Its delta |
|---|---|---|
| Useful crawl | Share of sampled hits that are 200-class and not an asset and carry no query string. robots.txt and sitemap requests are excluded from both sides |
Percentage points |
| Crawl hits | Sum of hits for the selected bot. Exact, not sampled | Percent change |
| Sitemap coverage | Sitemap URLs this bot has hit, divided by all sitemap URLs | None |
| Distinct paths crawled | Distinct paths in the sample, so it stops at 5000 | Absolute difference |
| Crawls per path | Sampled hits divided by sampled distinct paths — both sides from the sample, so the ratio stays comparable across site sizes | Absolute difference |
Status wins over path type when classifying waste: a 404 on an image counts as a not-found, not as an asset.
Bots vs Humans
Section titled “Bots vs Humans”All three tiles count paths, not hits, and none of them has a delta. The hit figures underneath them are context.
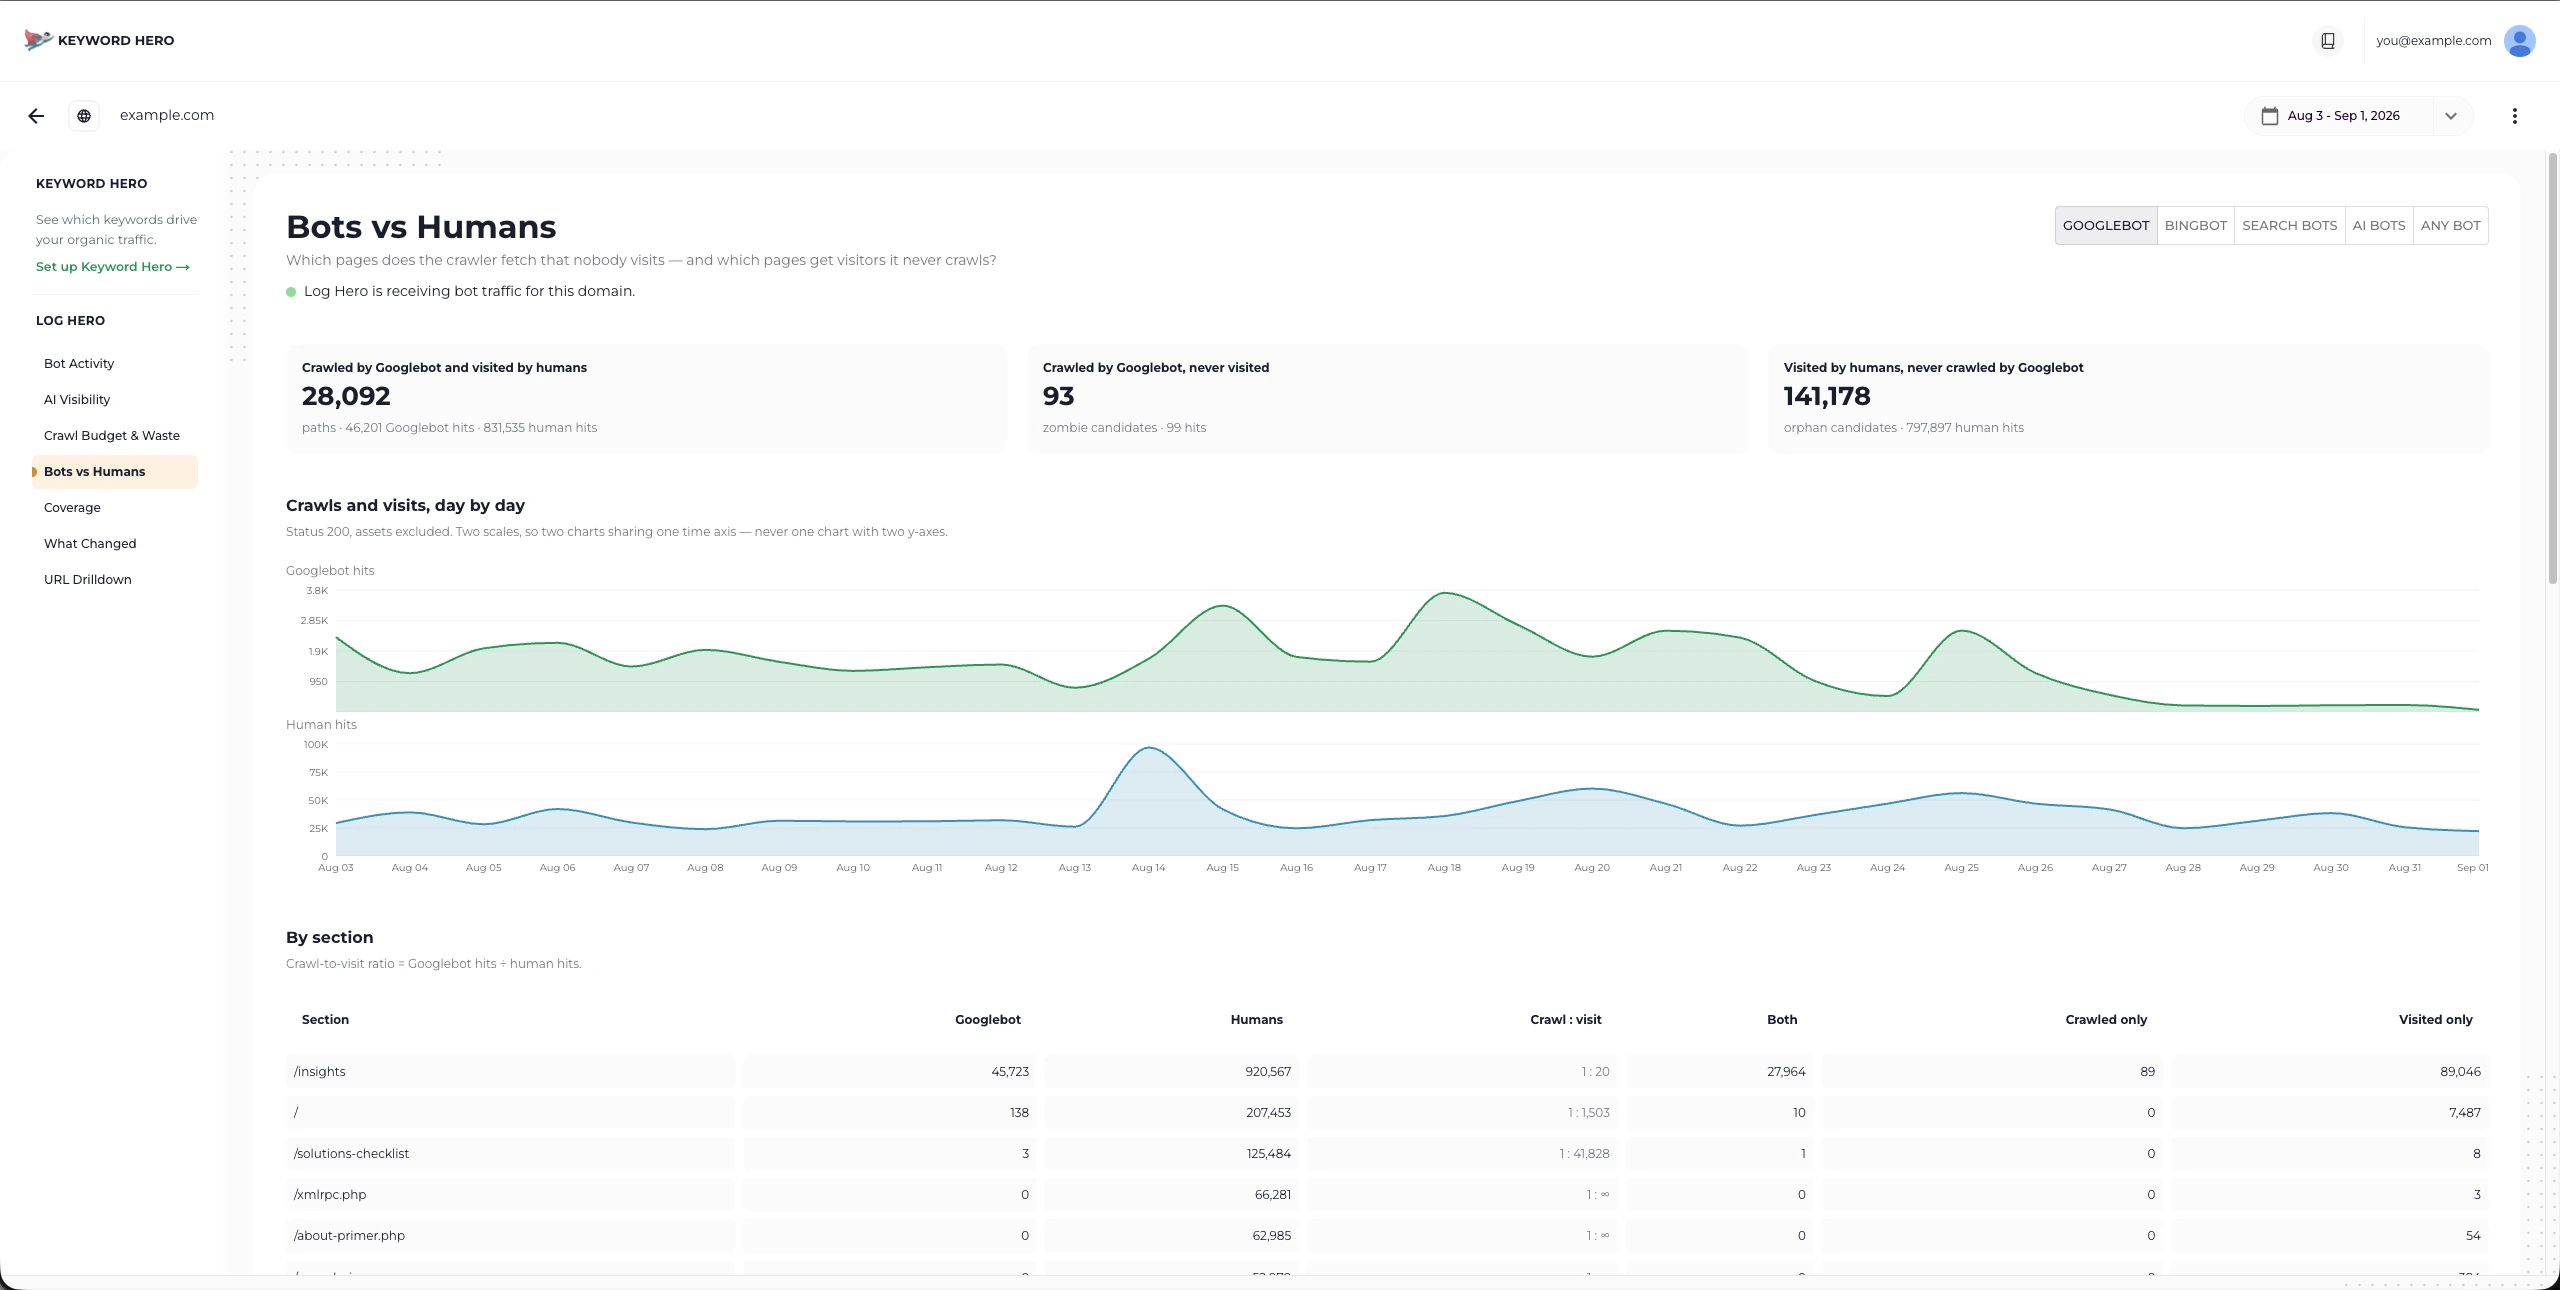
Bots vs Humans. The small print under each number is the hit count behind the path count.
| Metric | How it is calculated |
|---|---|
| Crawled and visited | Paths with at least one hit from the selected bot and at least one human hit |
| Crawled, never visited | Paths with bot hits and zero human hits |
| Visited, never crawled | Paths with human hits and zero hits from the selected bot |
Coverage
Section titled “Coverage”Needs a sitemap inventory. Every figure compares the stored snapshot of
your sitemap against hits in the selected window. Paths are normalised before
matching — hostname lower-cased with a leading www. removed, query string and
trailing slash dropped — so /page?utm_source=x and /page/ are the same URL
here.
| Metric | How it is calculated |
|---|---|
| Crawl Ratio | Sitemap URLs with at least one hit from the selected bot, divided by all sitemap URLs |
| Reached by any AI bot | The same ratio for the union of AI bots |
| Advertised, not crawled | Sitemap URLs minus those the selected bot has hit |
| Advertised, never requested by anyone | Sitemap URLs with no hits at all, from any bot or human |
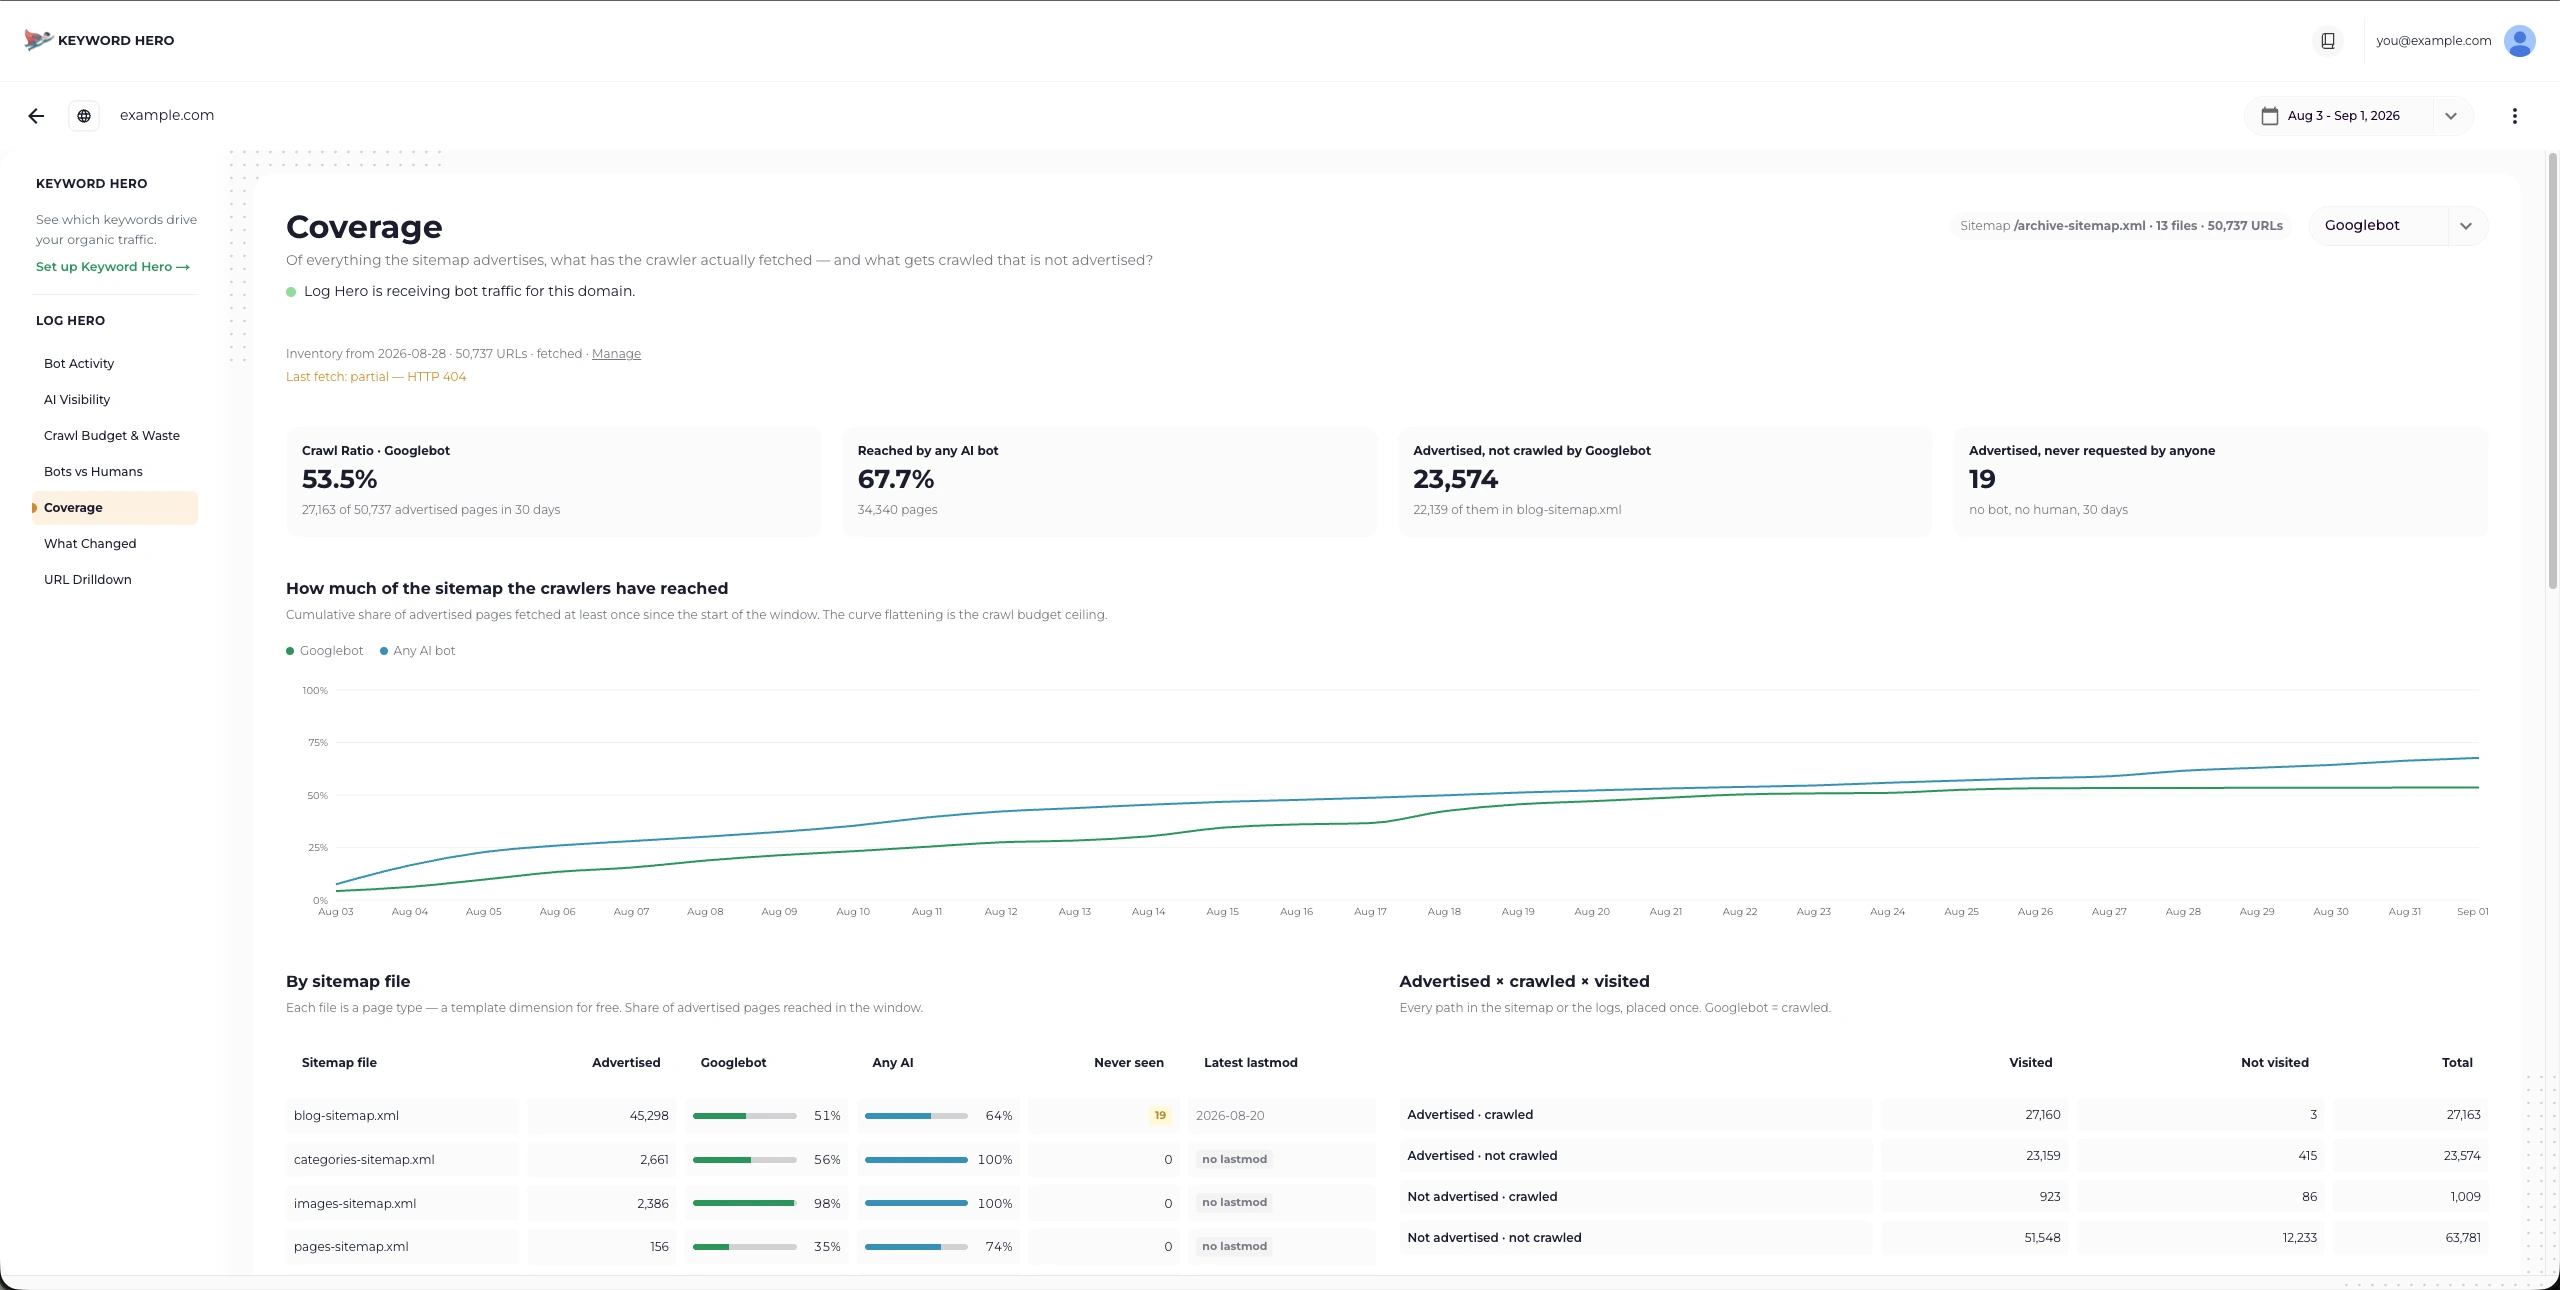
Coverage. Here AI bots have reached more of the sitemap than Googlebot has.
A ratio is always a union across the selected bots, never a sum, so it cannot exceed 100%.
What Changed
Section titled “What Changed”No tiles. The page compares the last complete seven days against the seven before them — a fixed window that ignores the date picker — and raises an alert when a movement clears one of these thresholds.
| Alert | Threshold |
|---|---|
| A bot crawls more or less | ±50%, and at least 100 hits in the larger week |
| A bot collapses | −90% or worse |
| A bot surges | +1000% or more |
| A bot appears or disappears | At least 50 hits on the side where it exists |
| Status mix shifts | 1 percentage point of share, in either direction |
| Response time moves | ±30%, with at least 200 hits in both weeks overall, or 100 per bot |
| A section starts 404ing | At least 20 404 hits last week, and a rise of 50% or more |
Two weeks is a short baseline, and these thresholds are the same for every project. Read an alert as something to look at, not as a finding.
URL Drilldown
Section titled “URL Drilldown”| Metric | How it is calculated |
|---|---|
| Bot hits / Human hits | Hits on this exact path, split by whether the request was classified as a bot |
| Dominant status | The status code with the most hits on this path in the window |
| Avg response | As Avg response, for this path only |
Exact match, so query-string variants are separate URLs and parameter URLs cannot be drilled into yet — their hits count against the base path.
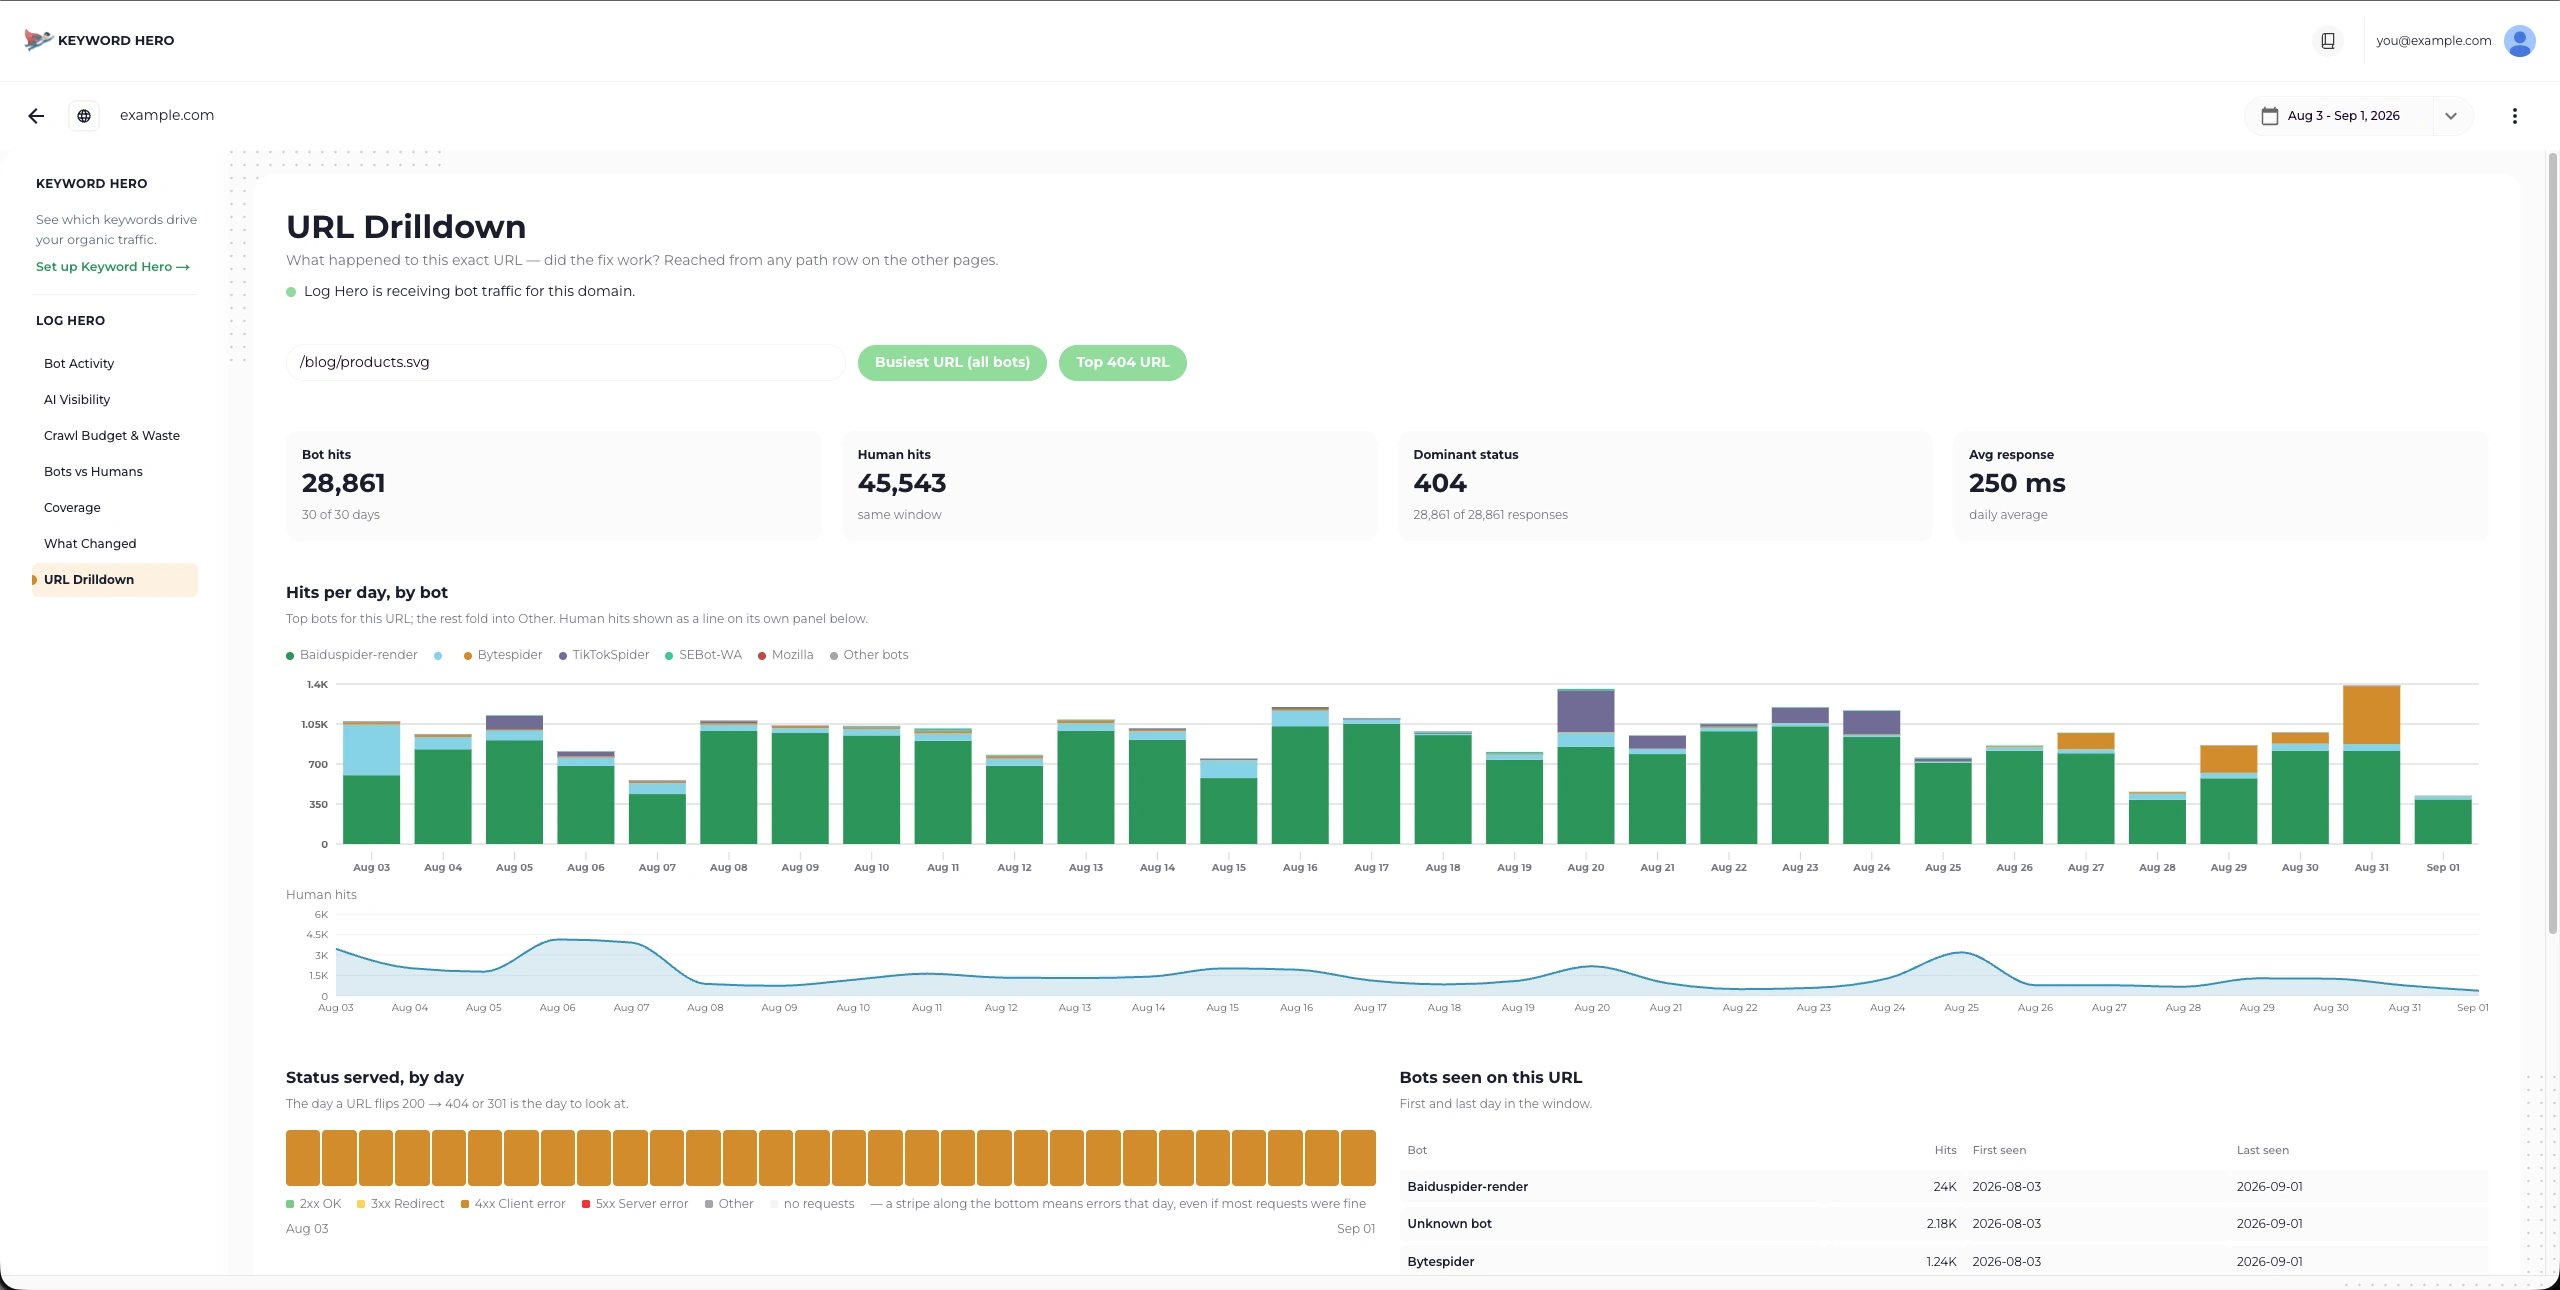
URL Drilldown. “28,861 of 28,861 responses” under the dominant status means every single request got the same code.
What none of these figures can tell you
Section titled “What none of these figures can tell you”- Errors that never reached your application. On the WordPress plugin and the PHP SDK only. See the note under Bot Activity.
- Soft 404s. A page that returns 200 with “not found” content is a 200 here.
- Whether an AI assistant cited you. Logs record the fetch, not the answer.
- Whether a crawled page is indexed. Pair Coverage with Search Console.
- Anything below a day. No hourly patterns, no request-level timing.