
Compare AI crawlers with Googlebot
“How much of my crawl traffic is AI now?” is the question everyone asks first. It is answerable in one figure — and the more useful comparison is not volume at all, but what each side reads.
Time: about 15 minutes · You need: at least 30 days of data for a trend
1. Get the share
Section titled “1. Get the share”Log Hero → AI Visibility, tile AI share of bot hits: AI-bot hits as a share of all bot hits. Its delta is against the previous period of the same length, so a 30-day window compares against the 30 days before it.
Treat the level as context and the direction as the finding. The absolute share depends on how much Googlebot happens to be crawling you this month, which moves for reasons that have nothing to do with AI.
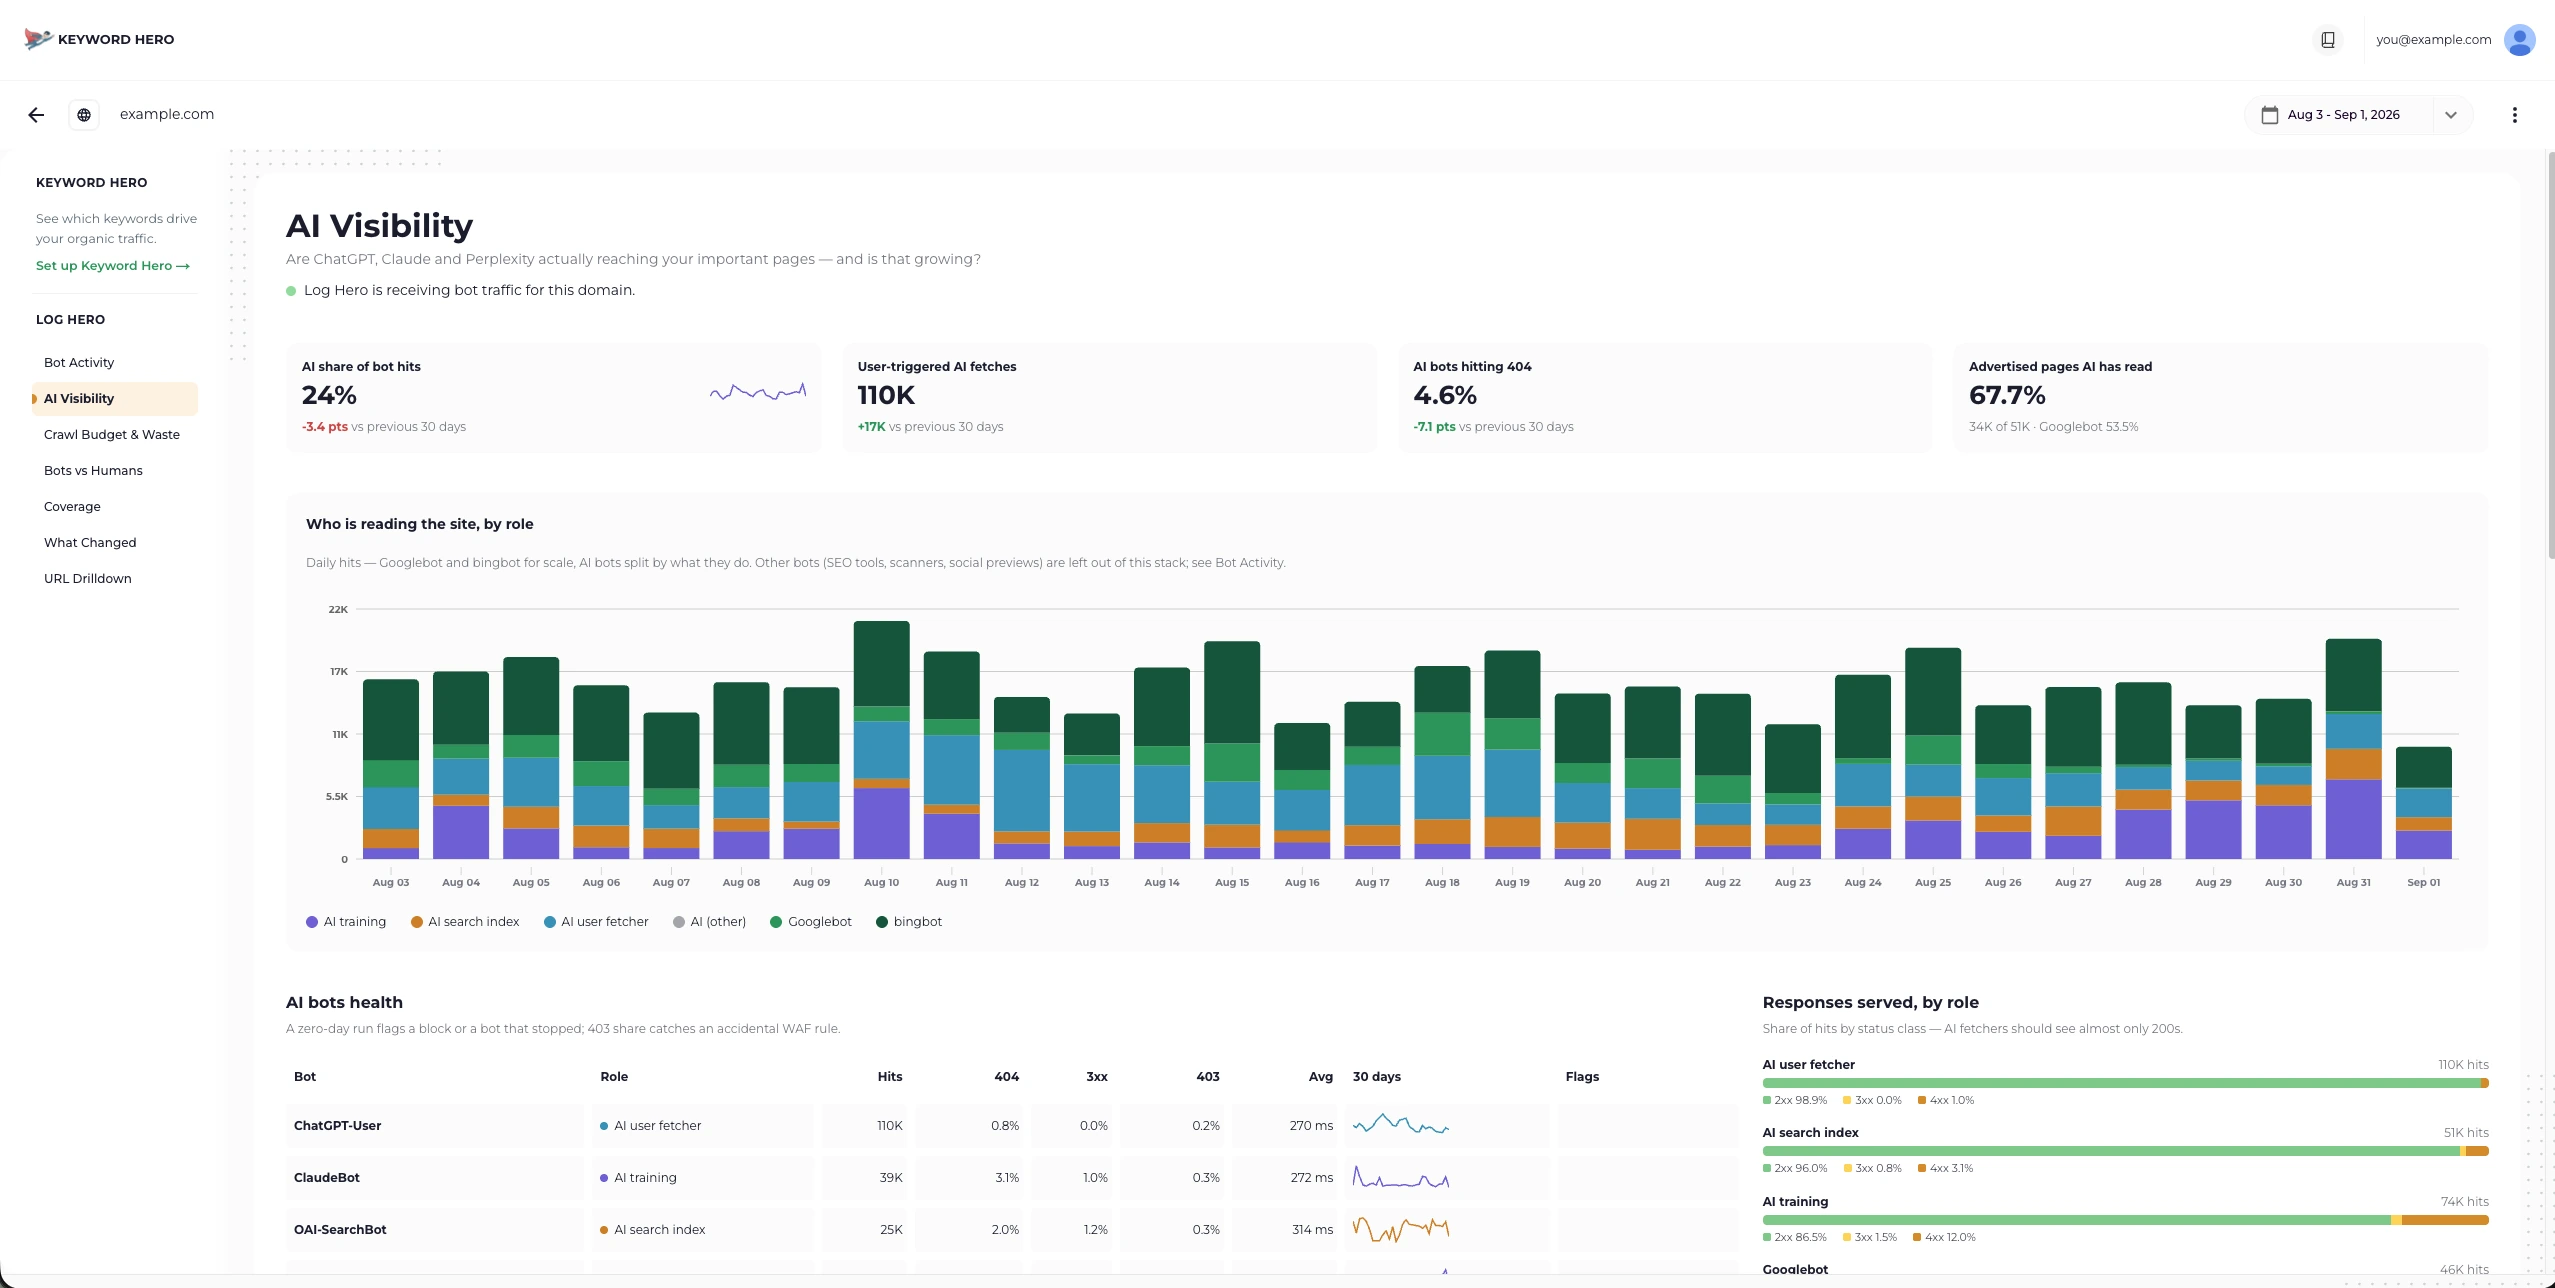
AI share sits at 24% here, down 4.2 points on the previous 30 days.
For the shape over time rather than a single number, use the daily chart on Bot Activity with the breakdown set to Category.
2. Compare what each side reads
Section titled “2. Compare what each side reads”This is the part that changes decisions. Sections AI reads vs Google reads gives you, per section of your site, the hits from Googlebot next to the hits from AI bots and the AI share of that section.
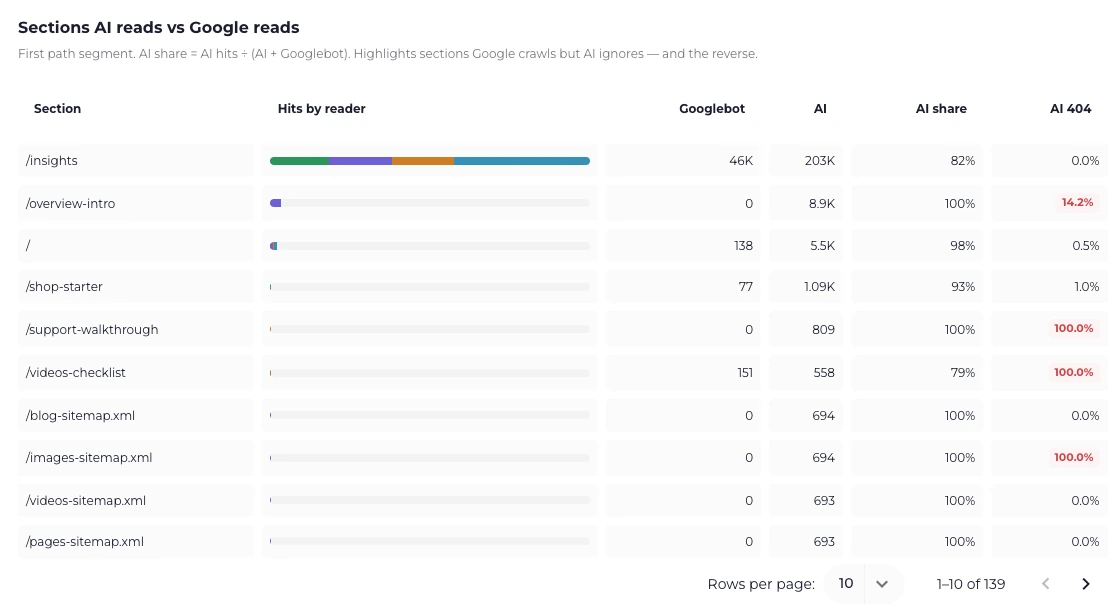
Sections with 100% AI share and zero Googlebot hits are the ones to look at first — and an AI 404 rate of 100% means AI is chasing a section that is not there. Three patterns worth acting on:
- High AI share, low Google share. Content that answers questions well and ranks poorly. Usually documentation, guides, FAQs. Often your best under-exploited asset.
- High Google share, near-zero AI share. Commercial and navigational pages. Normal, and not a problem to fix.
- A section neither side reads. Check it is reachable at all before concluding no one wants it. Coverage will tell you whether it is even advertised.
3. Compare how each side is treated
Section titled “3. Compare how each side is treated”Same window, Bot Activity → bots table. Put Googlebot’s row next to the AI bots’:
- Status mix. Are AI bots getting more 404s or 403s than Googlebot for the
same site? A gap points at a rule that distinguishes them — a WAF, a
user-agent check, or
robots.txt. - Avg response. A large gap usually means the two are being served different things: one hitting cached pages, the other hitting paths that miss the cache.
4. Sanity-check the comparison
Section titled “4. Sanity-check the comparison”Before you put the number in a slide:
- Googlebot has several crawlers. Smartphone, image, video and AdsBot all crawl for different purposes. Compare like with like where the split matters.
- Verified only, if the number is going public. Unverified bots claiming a name inflate both sides. The verification panel on Bot Activity is the filter for this.
- Cached hits. If your integration runs at the origin behind a CDN, both sides are undercounted — but not necessarily by the same amount, since the two do not request the same mix of pages.
What the comparison does not mean
Section titled “What the comparison does not mean”A rising AI share is not evidence of rising AI referrals, and crawl volume is not attention. AI crawlers fetch far more than any model ever surfaces. The figure to pair this with is User-triggered AI fetches, which at least implies a person asked something.