
The beginner’s guide to log file analysis
Log file analysis is the kind of topic that sends everyone but the most technical SEO running for the hills. Push through the jargon, though, and there is a gold mine underneath: your server log is the single most complete record of what happens on your site, and for crawlers it is the only record there is.
This guide is written for someone doing it for the first time. It covers:
- what log file data is, and why nothing else can replace it
- how to read a log line, field by field
- where to find your own logs
- what to look for once you have them, and what to do about it
What is a log file?
Section titled “What is a log file?”A log file is your server’s record of who asked for what. Every time anyone —
a person, Googlebot, GPTBot, a scraper — requests a page, an image or a
stylesheet, your server writes one line describing the request and the answer it
gave.
A single line looks like this:
66.249.66.1 - - [30/Sep/2026:16:09:05 -0400] "GET /dashboards/ HTTP/1.1" 200 "-""Mozilla/5.0 (compatible; Googlebot/2.1; +http://www.google.com/bot.html)"Dense, but not complicated. We take it apart below.
Almost every hosting setup writes these files automatically and keeps them for a while — often 7 to 30 days before they are rotated away. They are normally available only to the site owner.
Why you should care
Section titled “Why you should care”Analytics tools give you a great deal, but they cannot give you this. Google Analytics only knows about a visit if a JavaScript tag ran in a browser. Crawlers do not run JavaScript. The tag never fires, so a crawler is not a small number in your analytics — it is a zero, and always will be.
Your log has no such gap. It is written by the server, before any page renders, for every single request.
That mattered in 2017, when this meant Googlebot. It matters much more now. A
large and growing share of the machines fetching your pages are AI crawlers —
GPTBot, ClaudeBot, PerplexityBot, OAI-SearchBot — collecting training
data, building retrieval indexes, or fetching a page live because someone just
asked an assistant a question about you. None of them appear in analytics. All of
them appear in your log.
What Log Hero does has more on why this gap widened.
The building blocks
Section titled “The building blocks”Most of a log line is made of things you already half-know. Skip ahead if URLs and HTTP hold no surprises for you.
The URL
Section titled “The URL”A URL has three parts that matter here:
- The protocol (or scheme) — how the request is made.
http, or its encrypted counterparthttps. - The domain name — the name of your site. A DNS lookup turns
example.cominto the IP address of the server that answers for it. DNS is essentially a directory of names and the addresses behind them; we come back to it when we verify bots. - The path — the part after the first single slash,
/dashboards/. This is the resource being requested: a page, an image, a PDF, a stylesheet.
Put together: https://example.com/dashboards/
A query string can be appended with ?, as in
/search/?s=metrics&page=2 — variables separated by &. Query strings are
sent to the server and do appear in your log, which is why crawl budget so
often disappears into filter and sort parameters.
A fragment — the #section at the end of a URL — does not. Browsers use it
to scroll to an anchor after the page has loaded, and never transmit it. No
fragment ever appears in a log file. If you are looking for one, stop looking.
HTTP methods and status codes
Section titled “HTTP methods and status codes”HTTP is the protocol clients and servers speak. The method says what kind of
request it is: GET fetches a resource and is nearly all of what you will see,
HEAD asks only for the headers, POST submits something.
The status code is your server’s verdict on the request, grouped by first digit:
| Class | Meaning |
|---|---|
2xx |
Success. 200 is the ordinary one. |
3xx |
Redirection. 301 permanent, 302/307 temporary. |
4xx |
The request cannot be fulfilled. 403 denied, 404 not found. |
5xx |
Your server failed. 500 crashed, 503 unavailable. |
The one to internalise: 4xx is an answer, 5xx is a failure. A crawler
treats a 404 as information about your site and updates its map. It treats a
500 as your problem, keeps what it has, and slows down until you recover.
Status codes has every code that matters and what each one does to your crawling.
The user agent
Section titled “The user agent”Every client identifies itself with a User-Agent string. It is how you tell a crawler from a person, and one crawler from another:
Googlebot desktopMozilla/5.0 (compatible; Googlebot/2.1; +http://www.google.com/bot.html)
Googlebot smartphoneMozilla/5.0 (Linux; Android 6.0.1; Nexus 5X Build/MMB29P) AppleWebKit/537.36(KHTML, like Gecko) Chrome/W.X.Y.Z Mobile Safari/537.36 (compatible;Googlebot/2.1; +http://www.google.com/bot.html)
Note that Google runs several crawlers — desktop, smartphone, images, video, ads — and they are separate lines in your log.
One caveat that shapes everything downstream: a User-Agent is a claim, not an
identity. It is a text field the client fills in, and anyone can type
Googlebot into it. Verifying that claim is a job of its own, covered below.
Reading a log line, field by field
Section titled “Reading a log line, field by field”Back to our example:
66.249.66.1 - - [30/Sep/2026:16:09:05 -0400] "GET /dashboards/ HTTP/1.1" 200 "-""Mozilla/5.0 (compatible; Googlebot/2.1; +http://www.google.com/bot.html)"| Field | Value here | What it tells you |
|---|---|---|
| Client IP | 66.249.66.1 |
Who made the request. The field bot verification is run against |
| Timestamp | 30/Sep/2026:16:09:05 -0400 |
When, with the offset from UTC — here UTC−4 |
| Method | GET |
A plain fetch |
| Path | /dashboards/ |
What was asked for |
| Protocol | HTTP/1.1 |
The version spoken |
| Status | 200 |
Your server answered successfully |
| Referrer | - |
Empty. Crawlers rarely send one |
| User-Agent | Mozilla/5.0 (compatible; Googlebot/2.1; …) |
Claims to be desktop Googlebot |
Depending on how your server is configured, a line may also carry the hostname, the server’s own IP, the number of bytes sent, and how long the response took.
That is the whole idea: a log file is nothing more than one such line per request. Every time anyone loads a page anywhere, a line like this is written somewhere.
Two of these fields are worth treating with suspicion: the client IP and the User-Agent are both supplied by the client, and both can be forged. How bot verification works covers what can be done about that.
Where to find your log files
Section titled “Where to find your log files”This depends entirely on your host, so the honest answer is check with them — but the usual places are:
- A hosting control panel. cPanel and Plesk both expose raw access logs for download.
- On the server, if you have shell access. Apache commonly writes to
/var/log/apache2/access.log, nginx to/var/log/nginx/access.log. - Your CDN. Cloudflare, CloudFront, Fastly and Azure Front Door can all deliver logs, and on a cached site theirs are the more complete ones.
- Managed WordPress hosts vary a lot; some offer downloads, some only a viewer, some nothing at all.
Files are usually plain text with a .log extension, rotated daily and deleted
after a couple of weeks.
How to analyse them
Section titled “How to analyse them”The manual way
Section titled “The manual way”The classic approach is to open the file in Excel and comb through a few hundred thousand rows. It works exactly once, for a small site, and then you never do it again.
The command line is faster if the file is on a server you can reach. The top crawlers hitting you:
awk '{print $12}' access.log | sort | uniq -c | sort -rn | head -20Every URL Googlebot got a 404 on:
grep 'Googlebot' access.log | awk '$9 == 404 {print $7}' | sort | uniq -c | sort -rnRequests per day, to spot a crawl spike:
awk -F'[:[]' '{print $2}' access.log | sort | uniq -cUseful for a quick look. The limits show up quickly: the field positions differ between log formats, logs rotate away before you get to them, one server’s log is not the whole site, and none of this tells you whether the thing calling itself Googlebot really was.
The five checks worth doing
Section titled “The five checks worth doing”Whatever tool you use, these are the questions that pay for themselves.
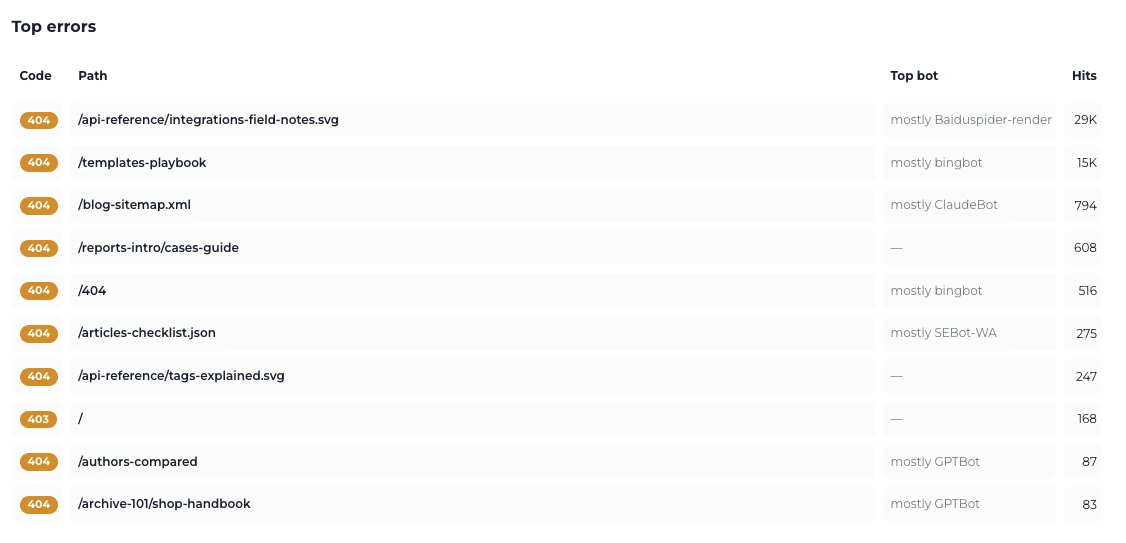
1. Are bots hitting errors, and which ones? A 404 on a page nobody links
to any more is fine. A 404 on your sitemap or robots.txt is an emergency —
Google would rather postpone crawling entirely than guess at a robots.txt it
cannot read. Rank errors by hit count, not by how many distinct URLs are
affected: one URL 404ing 400 times a week matters more than 400 URLs 404ing once.
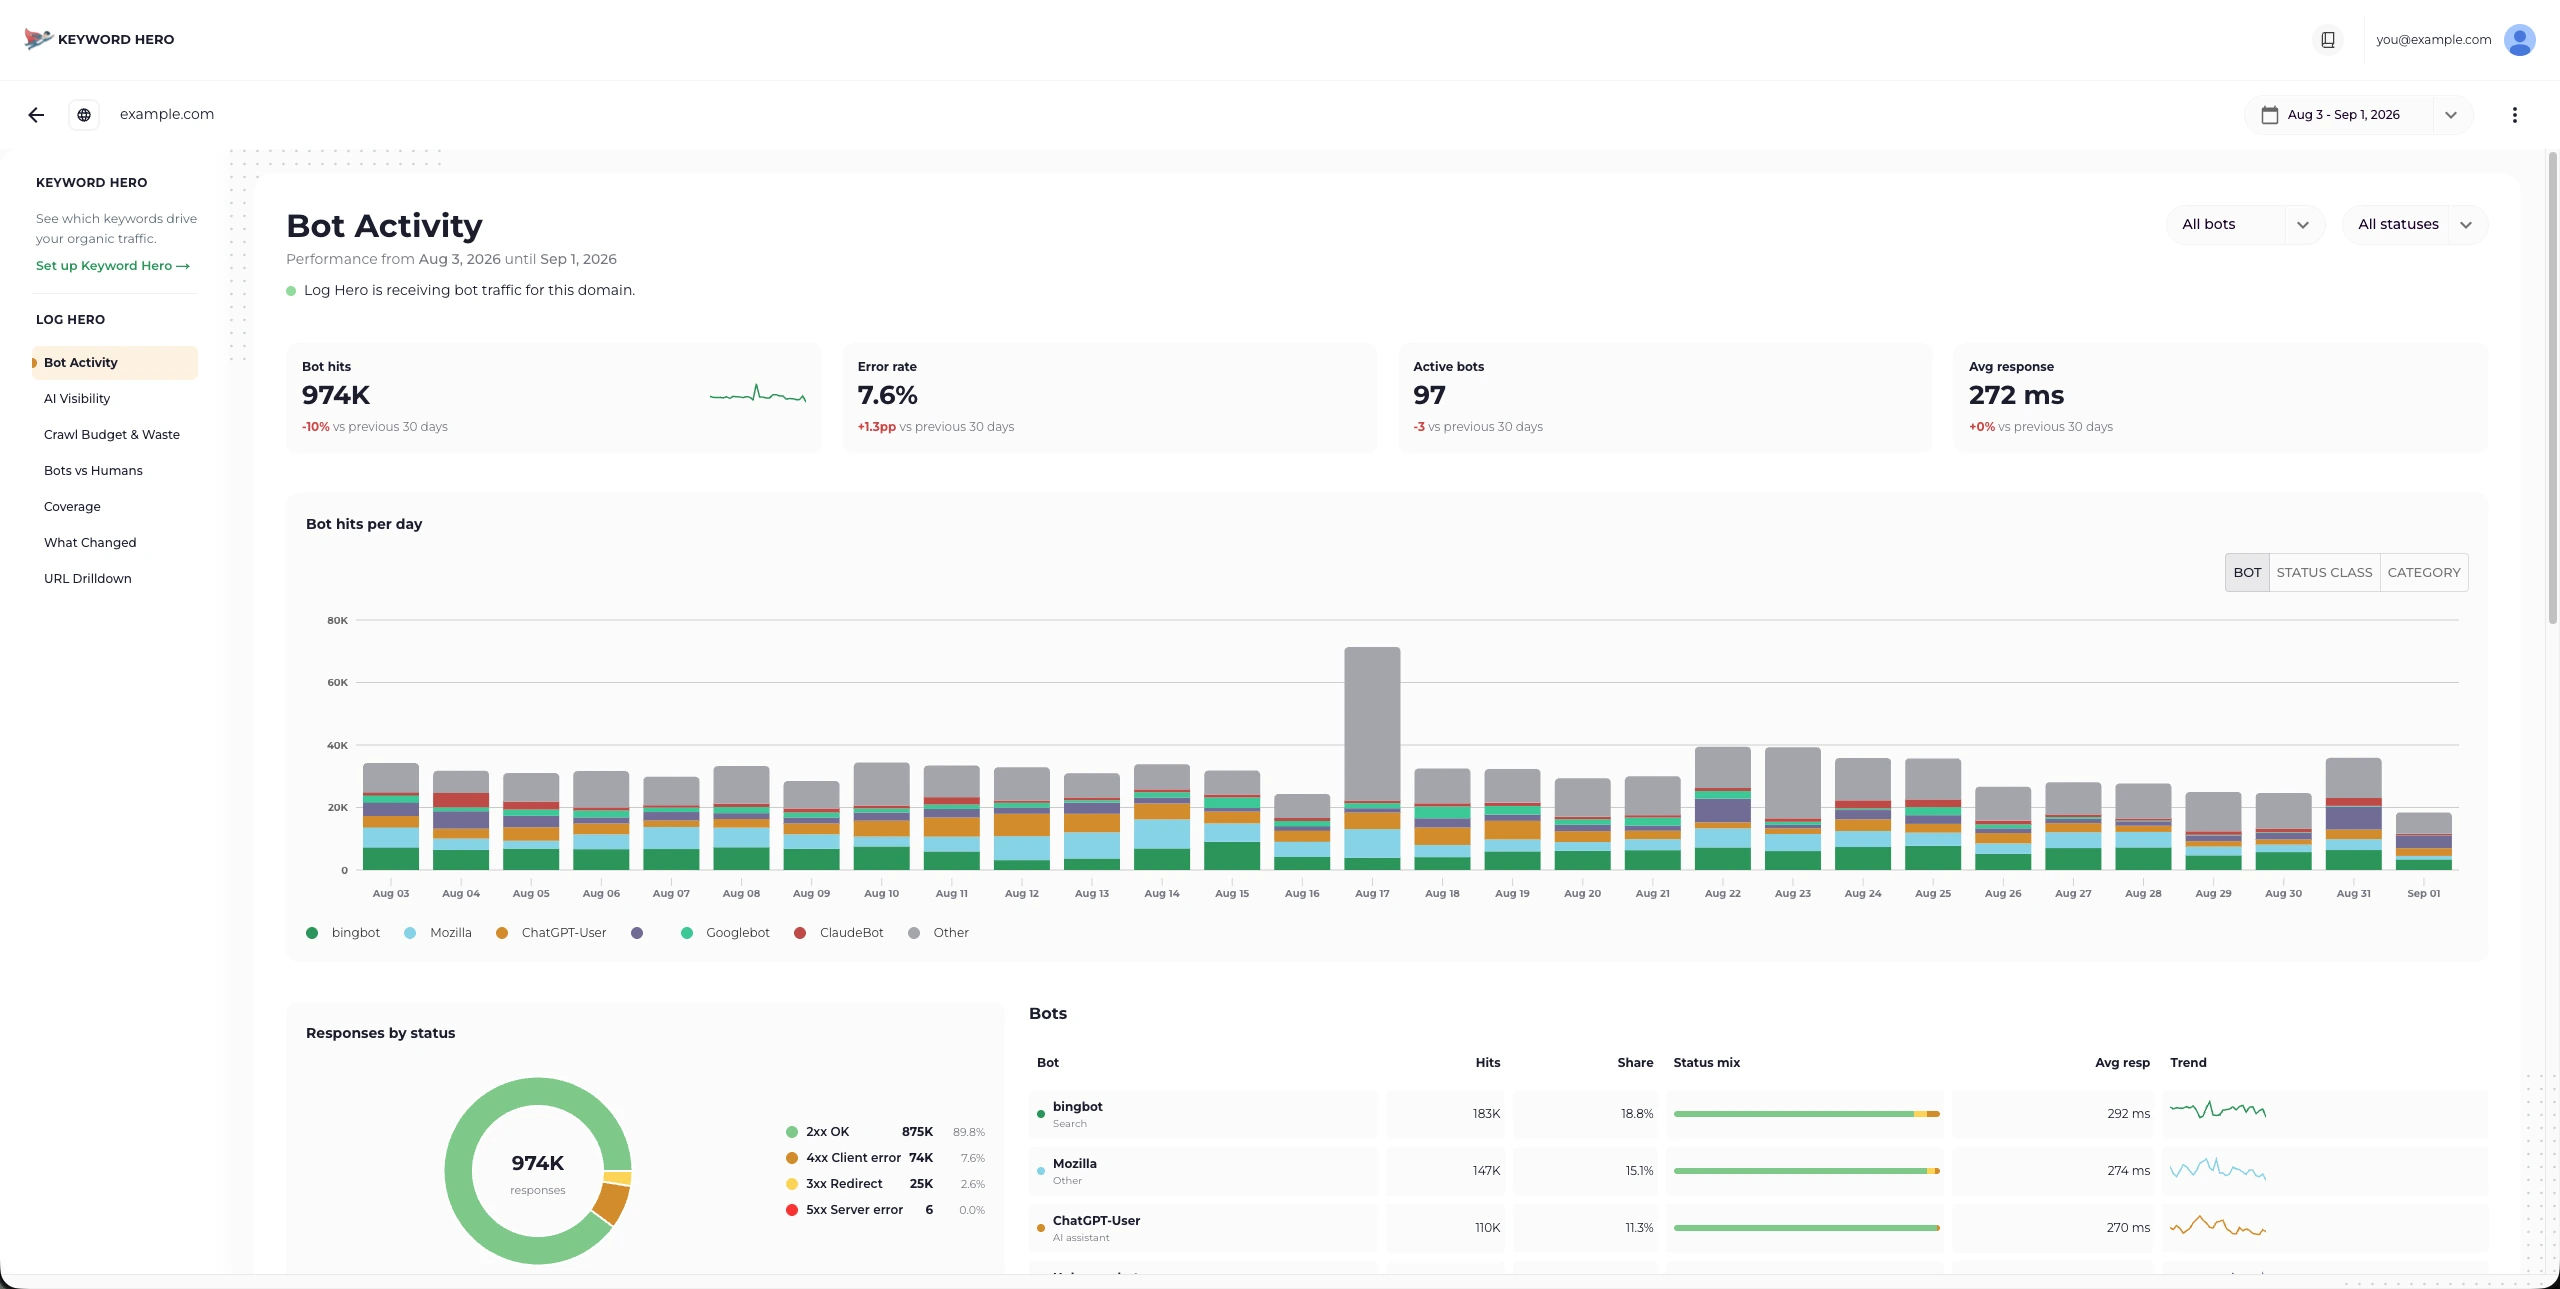
2. Who is actually crawling you? You do not need an account with every search engine to find out — the log names them all, including the AI crawlers and the RSS readers checking for new posts. Which ones come, how often, and whether that changed last week.
3. Is the bot real? Take the client IP and do a reverse DNS lookup:
$ host 66.249.66.11.66.249.66.in-addr.arpa domain name pointer crawl-66-249-66-1.googlebot.com.The name ends in googlebot.com, which is a good sign but not yet proof —
reverse DNS records can be set by whoever controls the IP block. So run it
forward as well, and check you land back on the same address:
$ host crawl-66-249-66-1.googlebot.comcrawl-66-249-66-1.googlebot.com has address 66.249.66.1Both directions agreeing is verification. One direction is a hint.
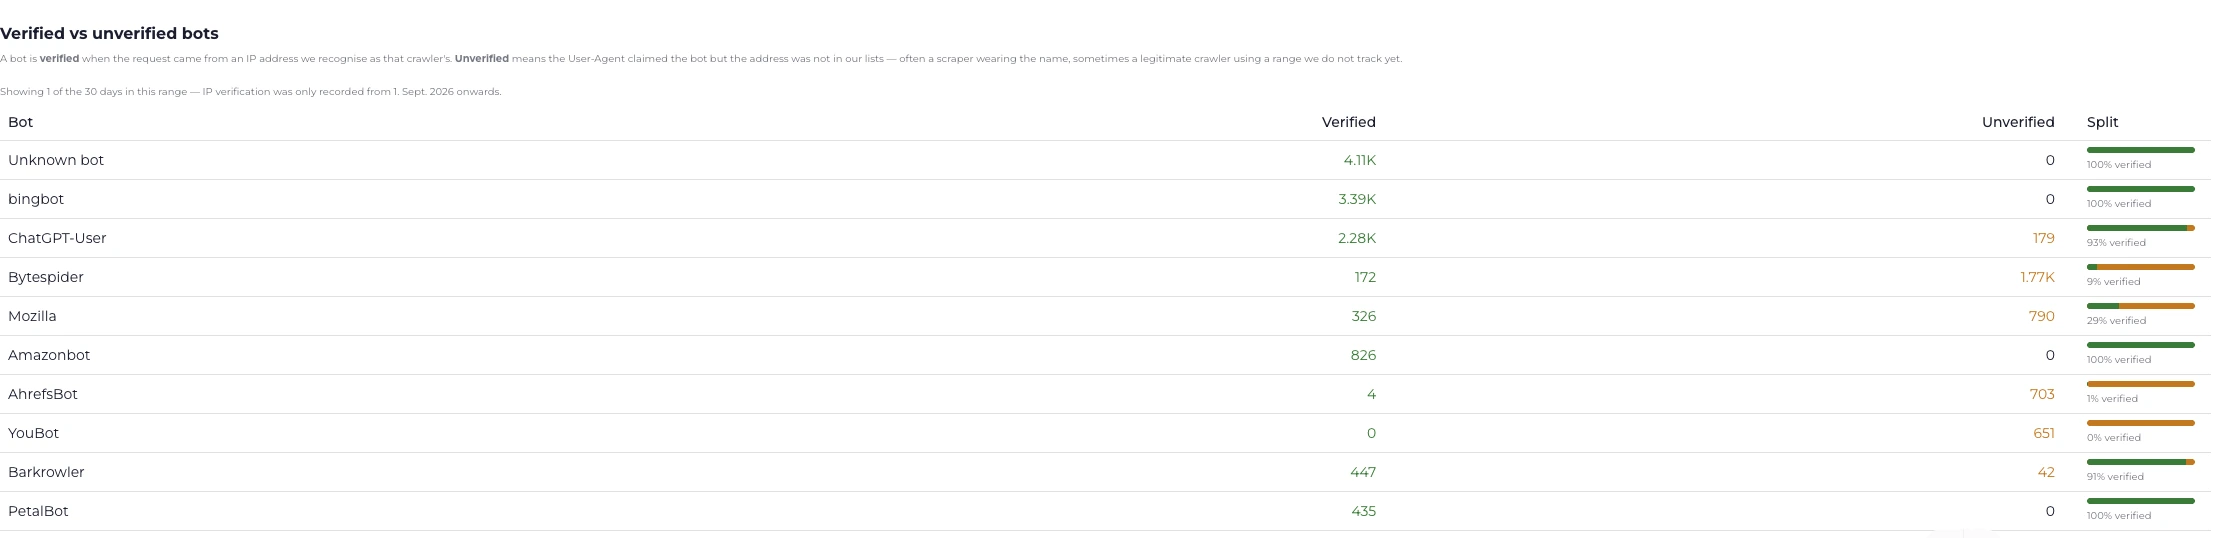
How bot verification works explains why unverified means suspicious rather than proven fake, and Detect fake Googlebots walks through what to do when the split looks wrong.
4. Where is crawl budget going? Crawlers have a finite appetite for your site. If most of it is spent on parameter URLs, paginated archives, or assets, your actual content is being crawled less often than it could be.
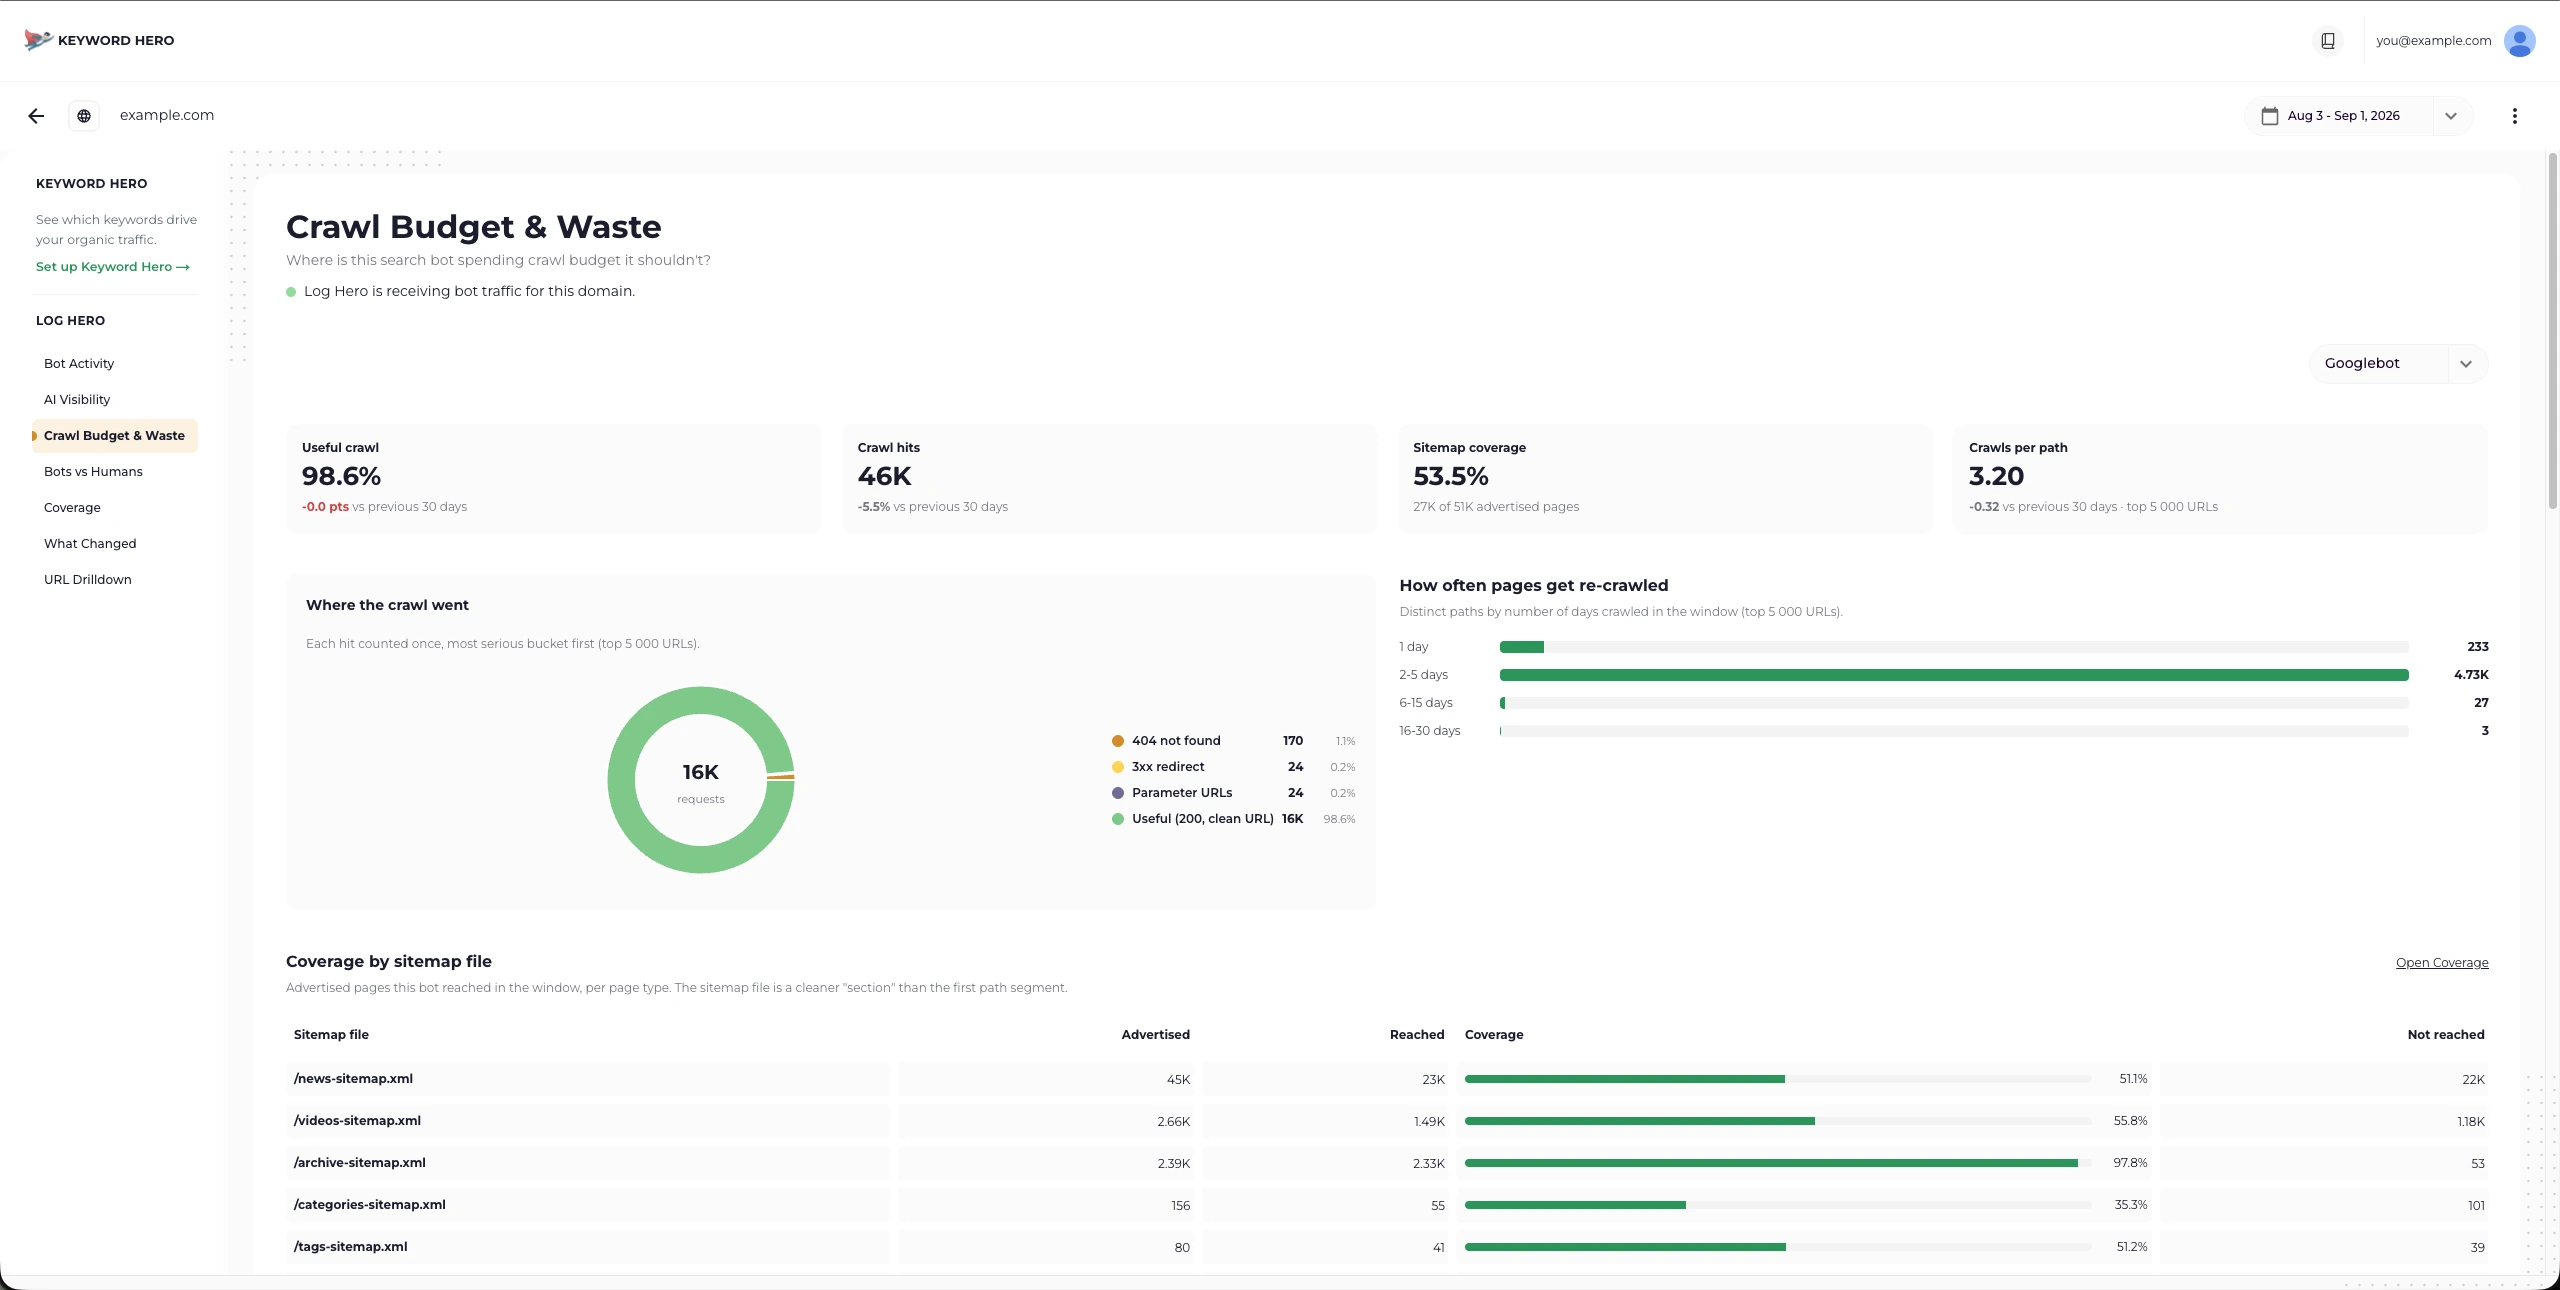
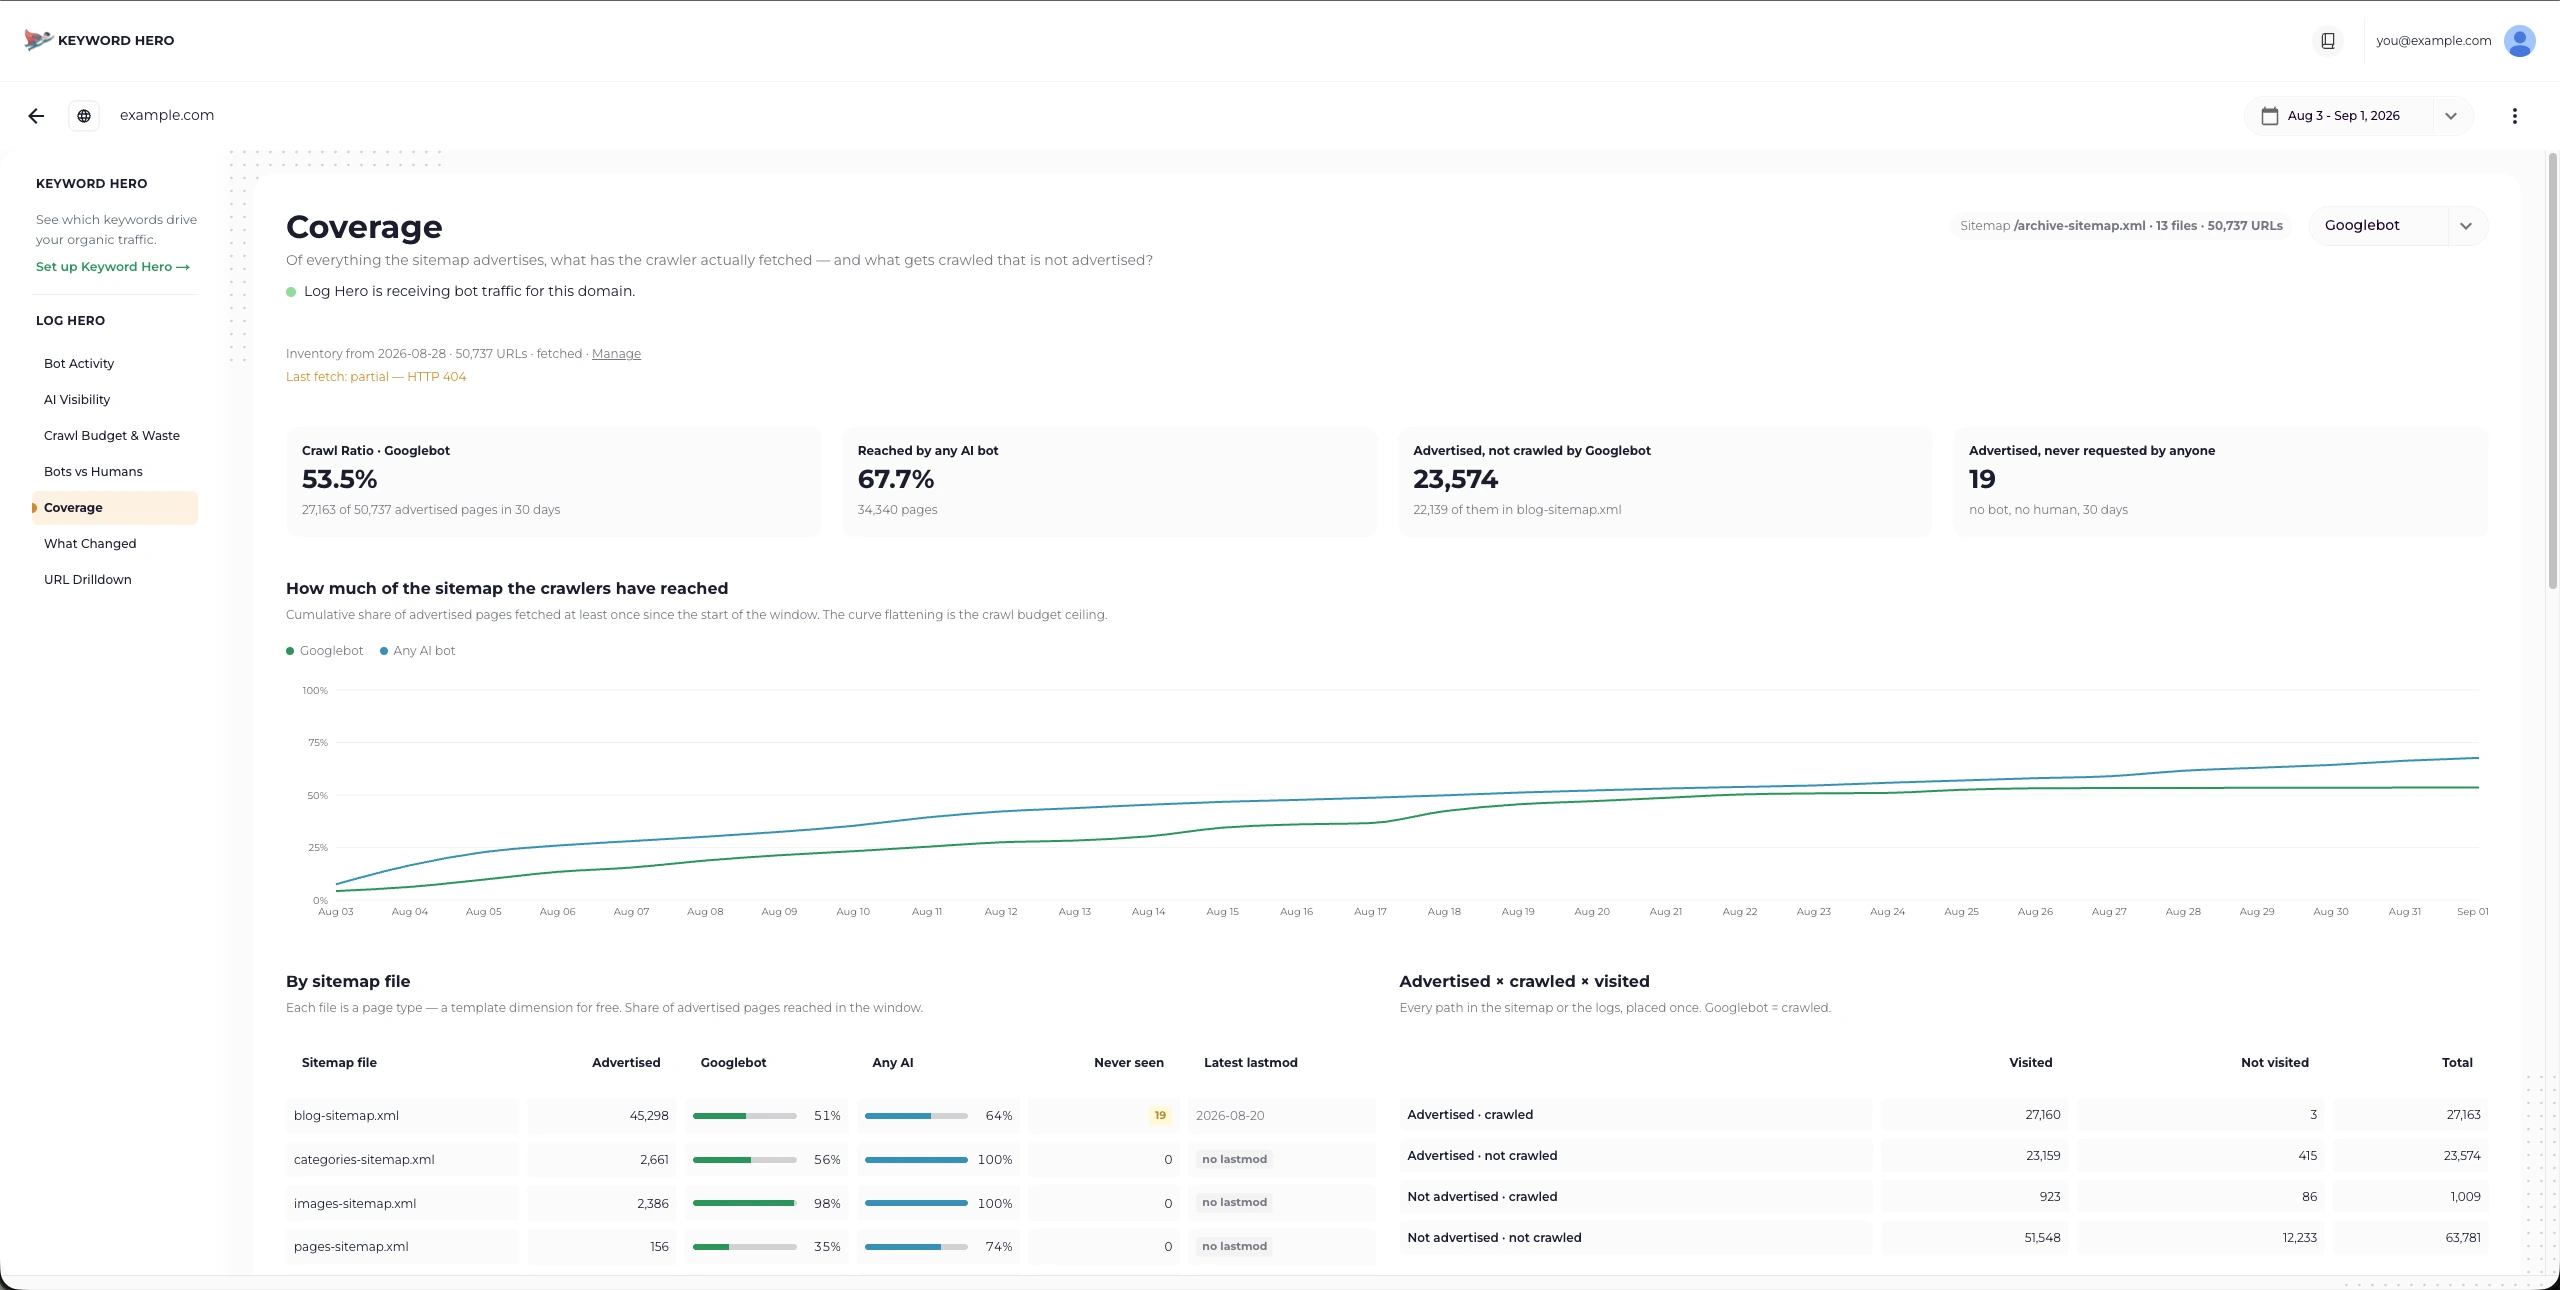
5. What is never crawled at all? Compare the URLs in your sitemap against the URLs in your log. Anything in the sitemap that no crawler has fetched in weeks is not being considered for indexing, and that is worth knowing before you wonder why it does not rank.
How Log Hero fits in
Section titled “How Log Hero fits in”Log Hero does the collection and the analysis for you. You install a plugin, a
web-server module or a CDN log stream once, and from then on every request is
recorded, classified and kept — no downloading files, no rotation to race
against, no awk.
What you get on top of the raw lines:
- Every bot named. We maintain one of the most complete crawler catalogues there is, matched on both User-Agent and IP, and grouped by what the bot is for: search, AI training, or AI assistant.
- Verification, automatically. Reverse and forward DNS is run for you on every request, so the verified/unverified split is simply a column.
- Seven reports rather than a spreadsheet: crawl volume over time, AI visibility, crawl budget waste, bots against humans, sitemap coverage, week-on-week changes, and a per-URL drilldown.
- A dedicated GA4 property, if you want the data next to your analytics. Log Hero creates a separate property so bot traffic never touches your real numbers, and fills it with custom dimensions — Bot Name, Is Bot, Official Bot, Spam Bot Type, Bot IP, Status Code, Method, Protocol, Timestamp, User Agent — plus Page Load Time as a metric.
See The Log Hero reports for what each report answers, and the GA4 property for what lands in Google Analytics.
Getting started
Section titled “Getting started”Log files contain information that exists nowhere else. Not just how your site performs, but who is asking for it — every crawler, every fetch, on every URL. And in a search landscape where an AI assistant may read your page and answer on your behalf, knowing which of them came and what they got is no longer a niche technical exercise.
You can do this by hand. Download a log, open a terminal, and the five checks above will already tell you something you did not know. If you would rather have it kept up to date without the file wrangling, that is what Log Hero is for.
Start here — setup takes about five minutes, and the free tier is enough to see whether your crawl data holds any surprises.